Tomorrow’s power price, today.
Quarter-hour electricity price forecasts for Spain, Portugal, France and Germany, checked against the real price every day.
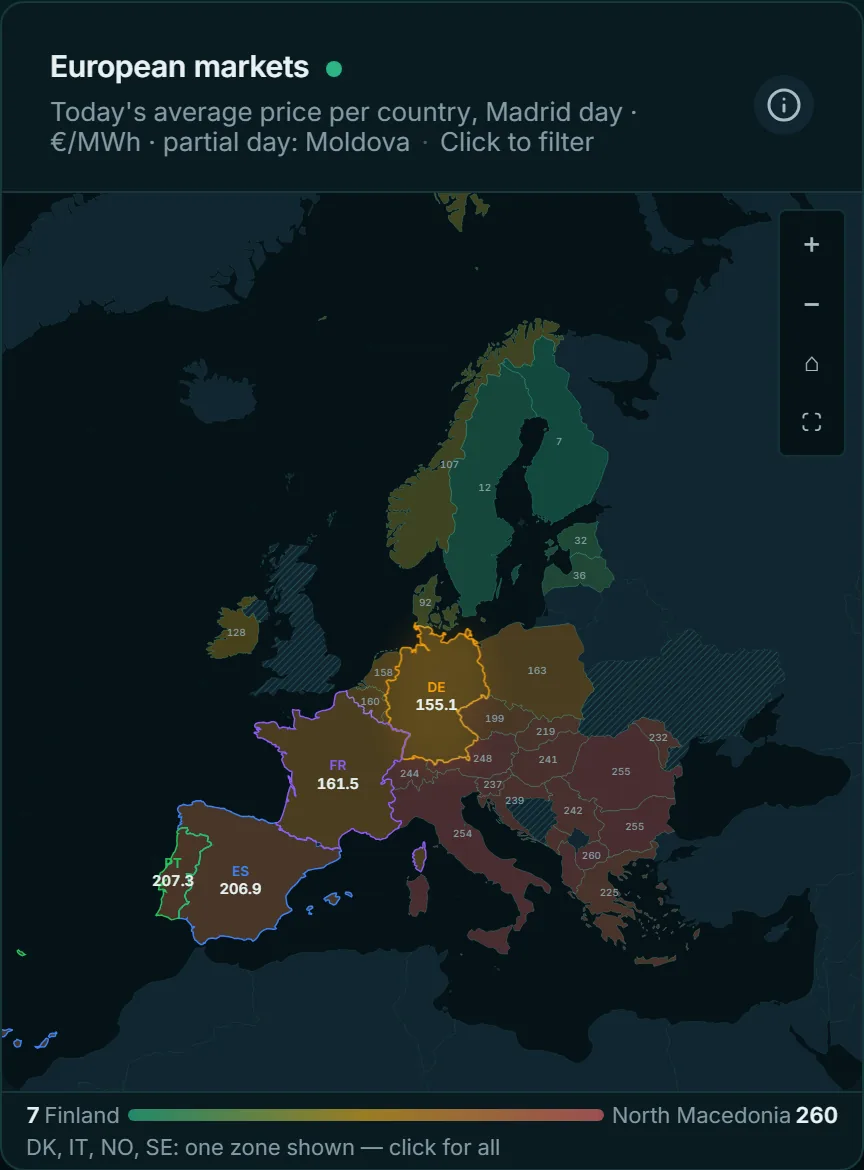
- Spain206.9 +5.1%
- Portugal207.3 +5.3%
- France161.5 +5.1%
- Germany155.1 +33.0%
- Italy North254.4 +1.7%
- Netherlands157.6 +11.1%
- Belgium160.4 −1.4%
- Austria247.7 +2.4%
- Switzerland244.3 +3.1%
- Poland162.6 −22.8%
- Czechia198.6 +2.5%
- Hungary241.3 −9.8%
- Romania255.5 −6.0%
- Greece224.8 −13.0%
- Denmark West92.3 +1.2%
- Norway Oslo107.0 +15.7%
- Sweden Stockholm12.0 +15.4%
- Ireland127.6 −23.8%
Day-ahead average on 27 October 2026, €/MWh, change on the day before
One app, from tomorrow’s price to what it is worth
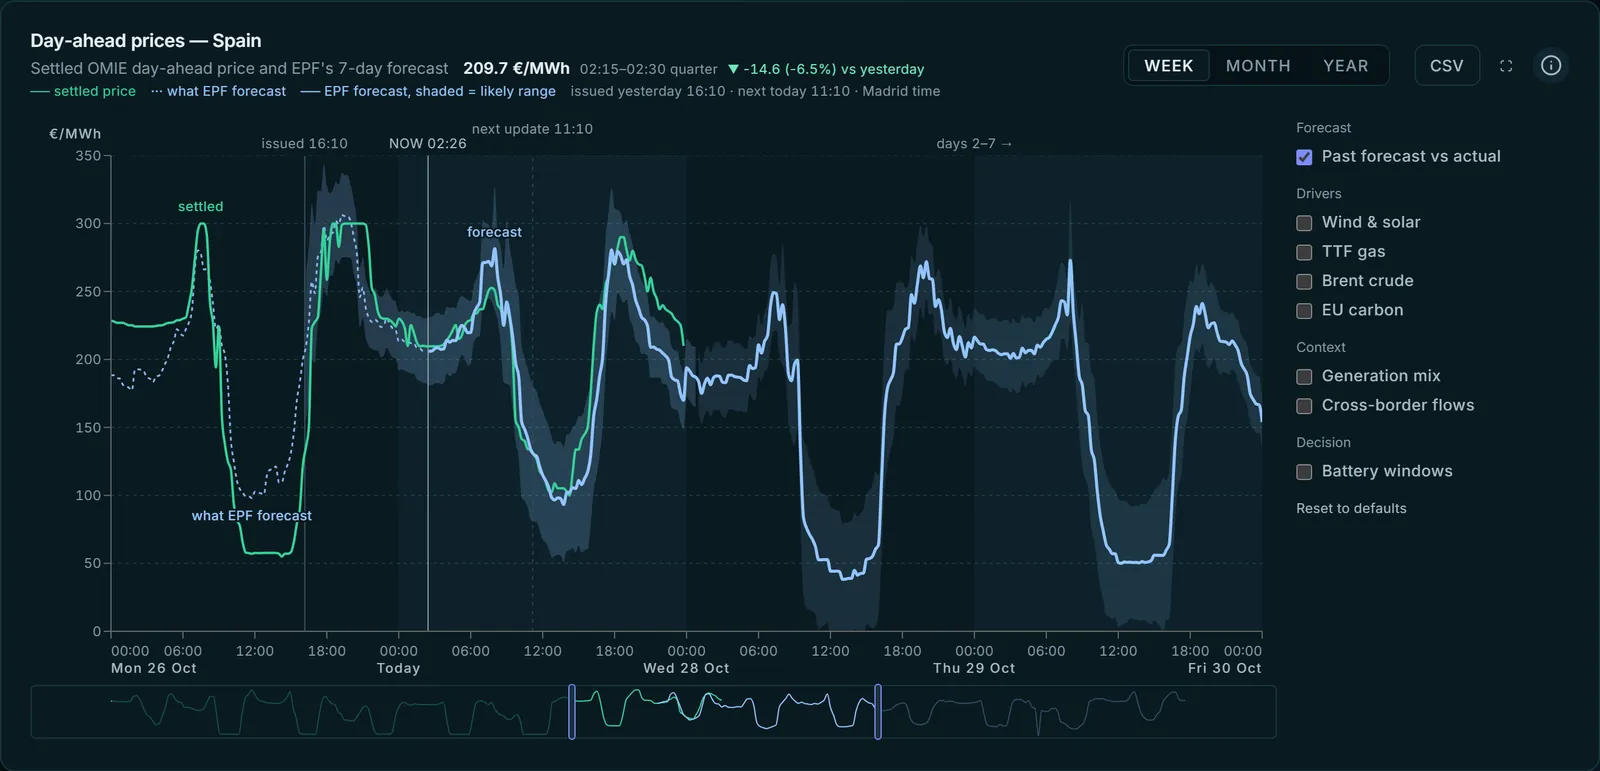
What will the price be?
- Tomorrow at 15-minute resolution, every morning.
- The next 7 days, every afternoon.
- A band shows the typical error for each time of day.
How does Europe compare?
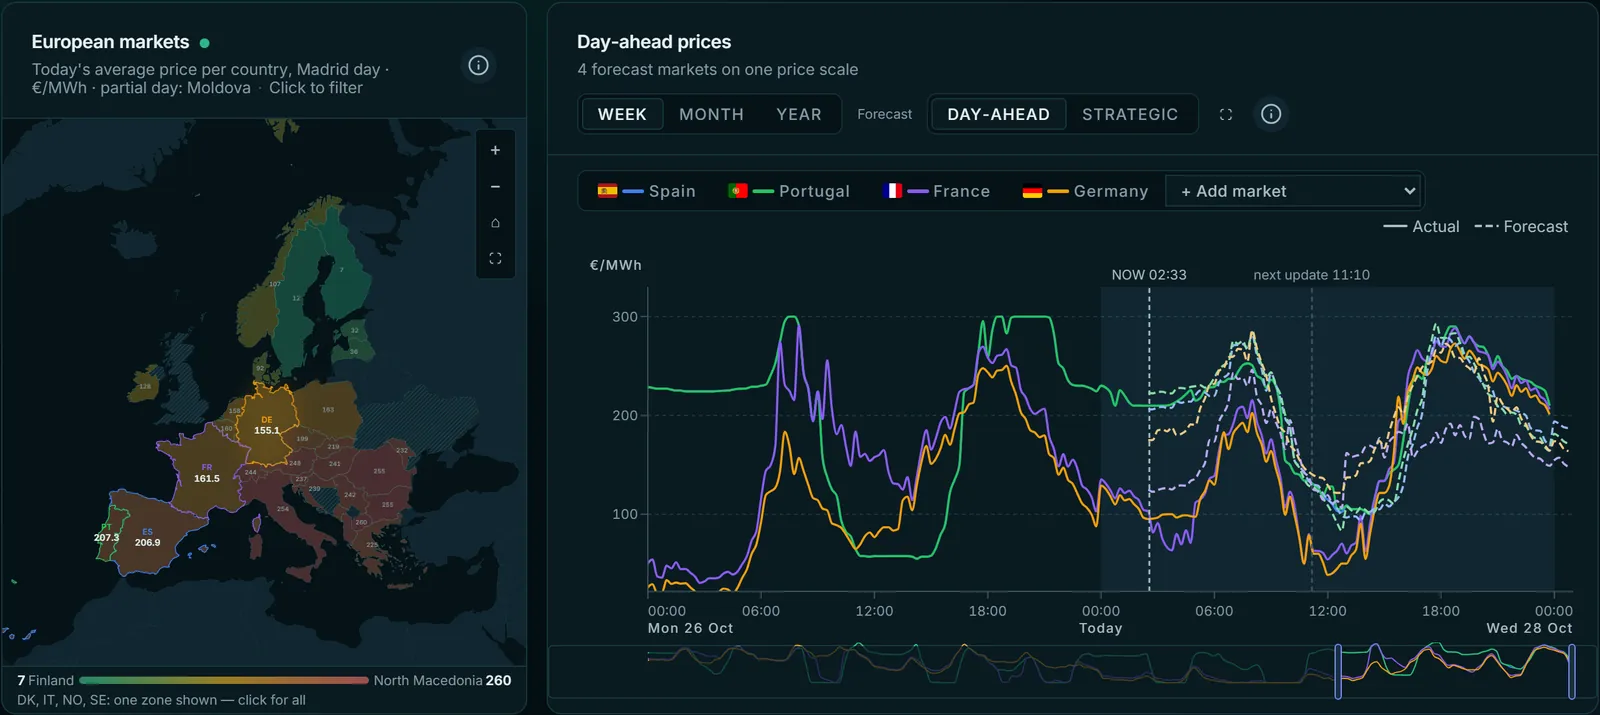
- Spain, Portugal, France and Germany forecast every day.
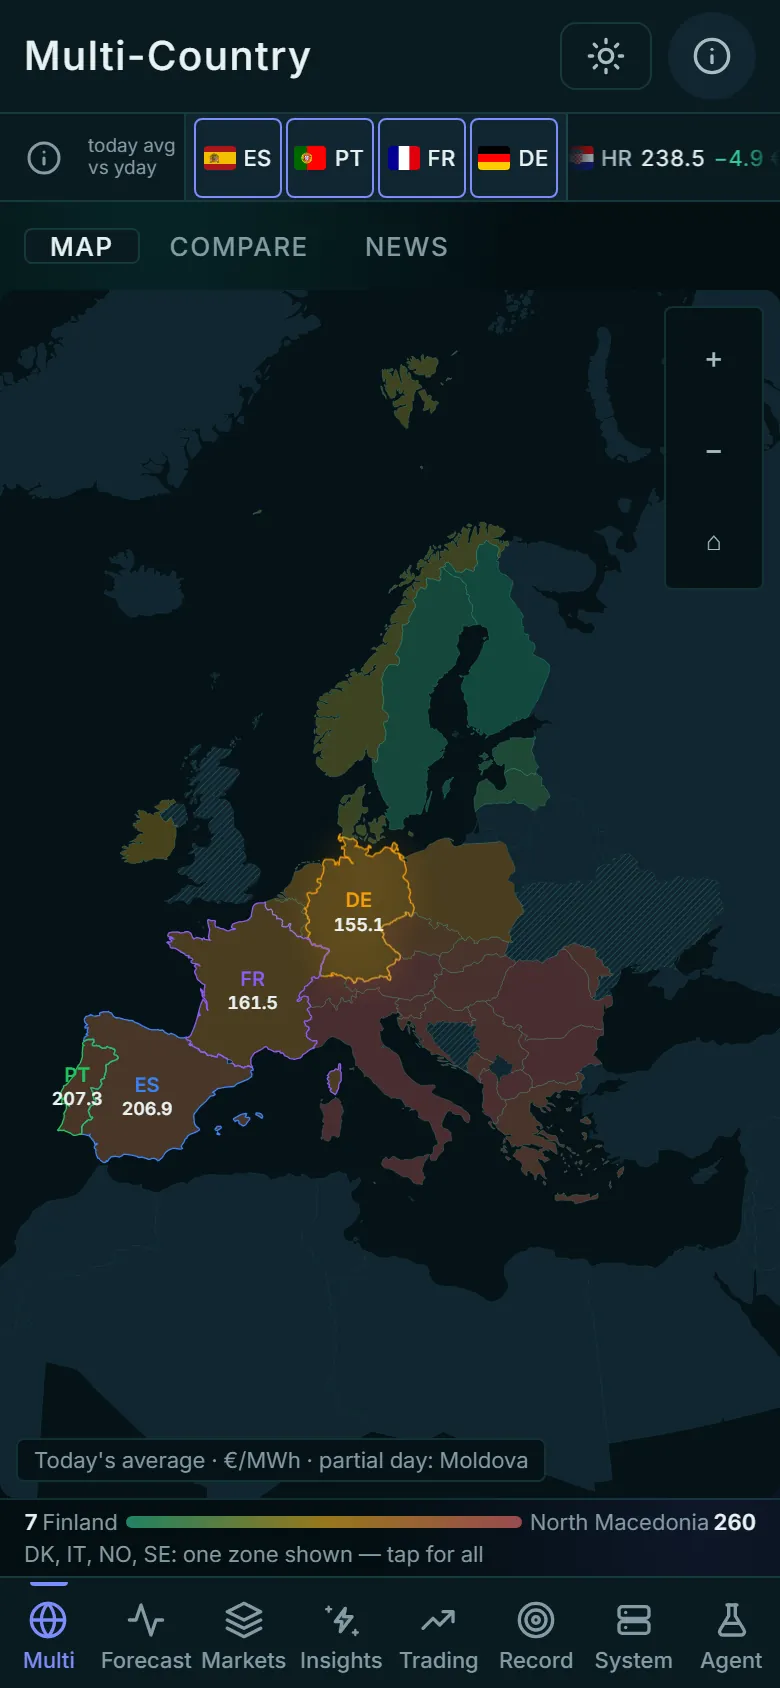
- Today’s price in 45 European bidding zones on one map (4 forecast).
- All four markets’ prices and forecasts on one chart.
What is every market doing?
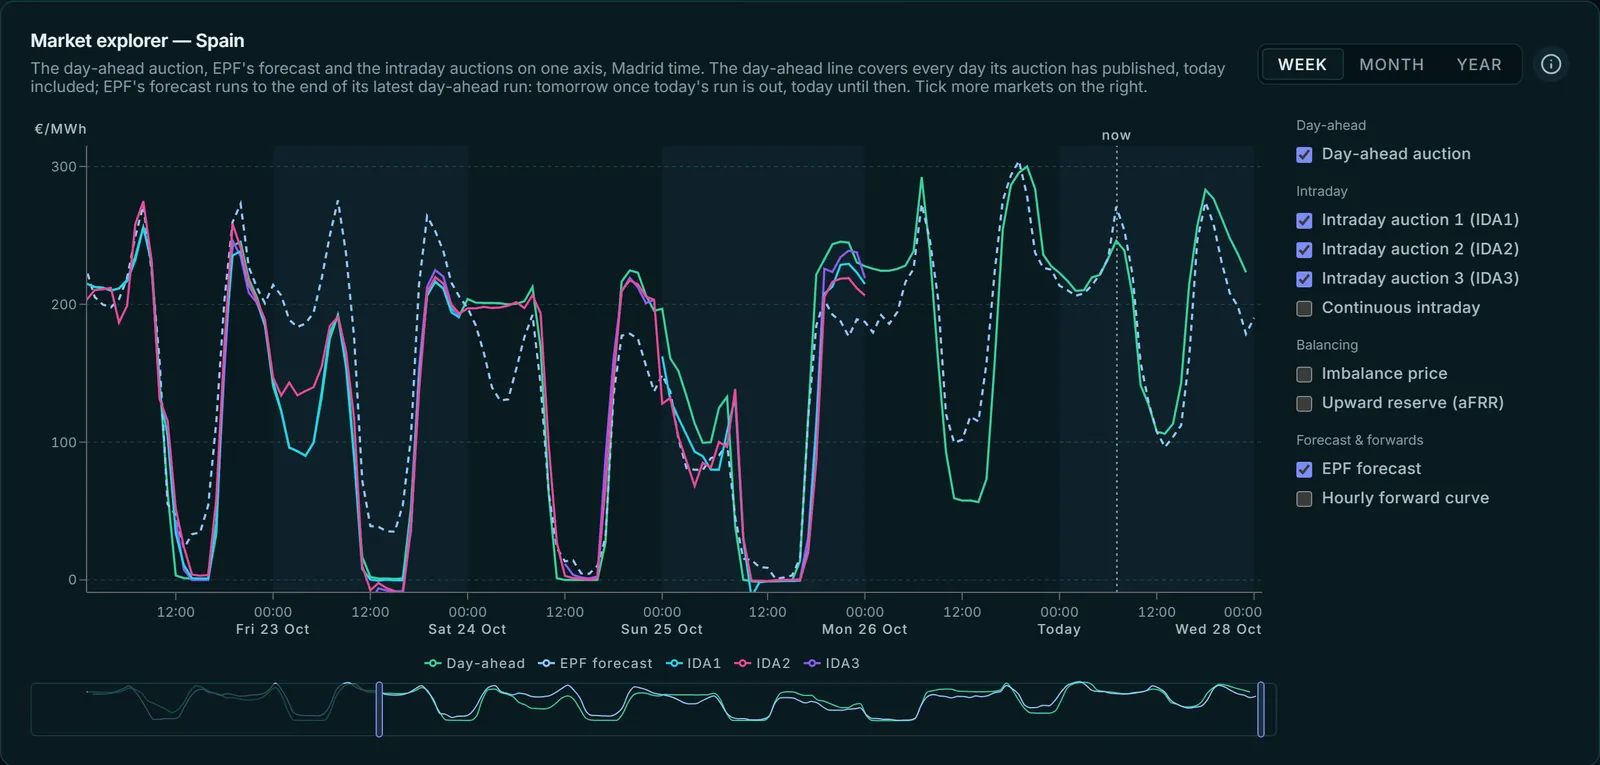
- Day-ahead, the three intraday auctions and EPF’s forecast on one axis.
- Balancing and forwards one tick away.
- The context in one place: regime radar, outages, gas and carbon, flows.
Can I trust it?
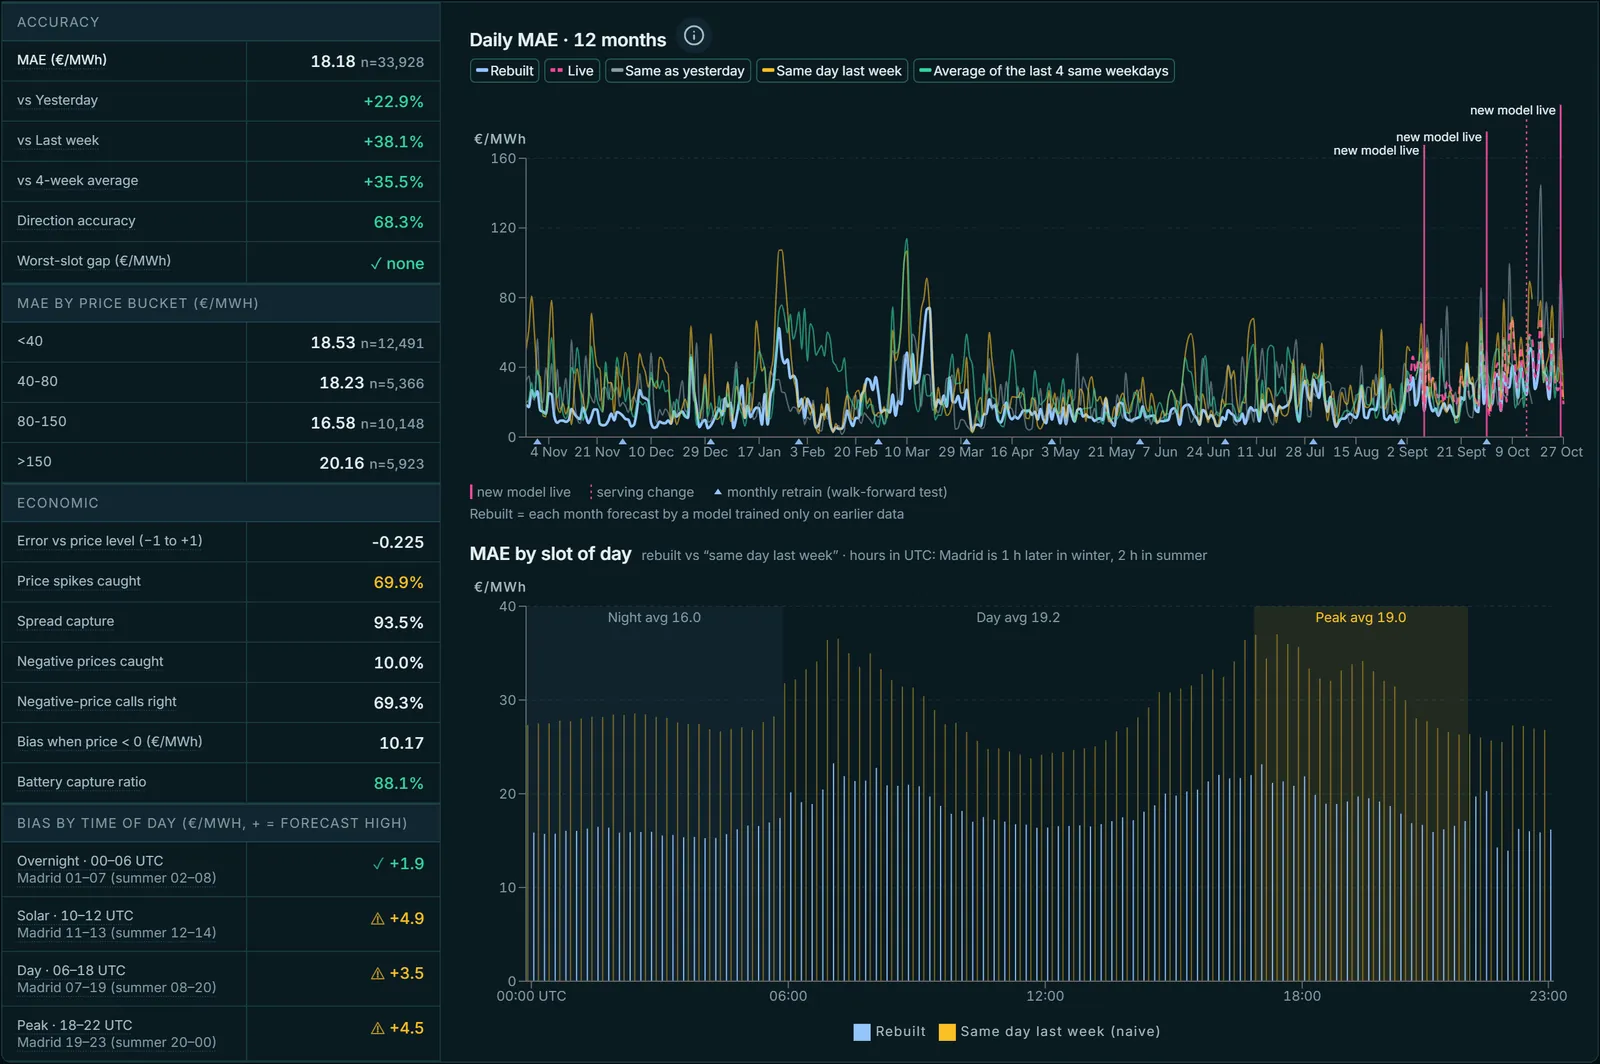
App screenshot, 27 Oct 2026
- Every forecast is checked against the price that actually cleared.
- And against rules of thumb anyone could use: same as yesterday, same day last week, the average of the last 4 same weekdays.
- The scores are public and updated every day.
Is it worth acting on?
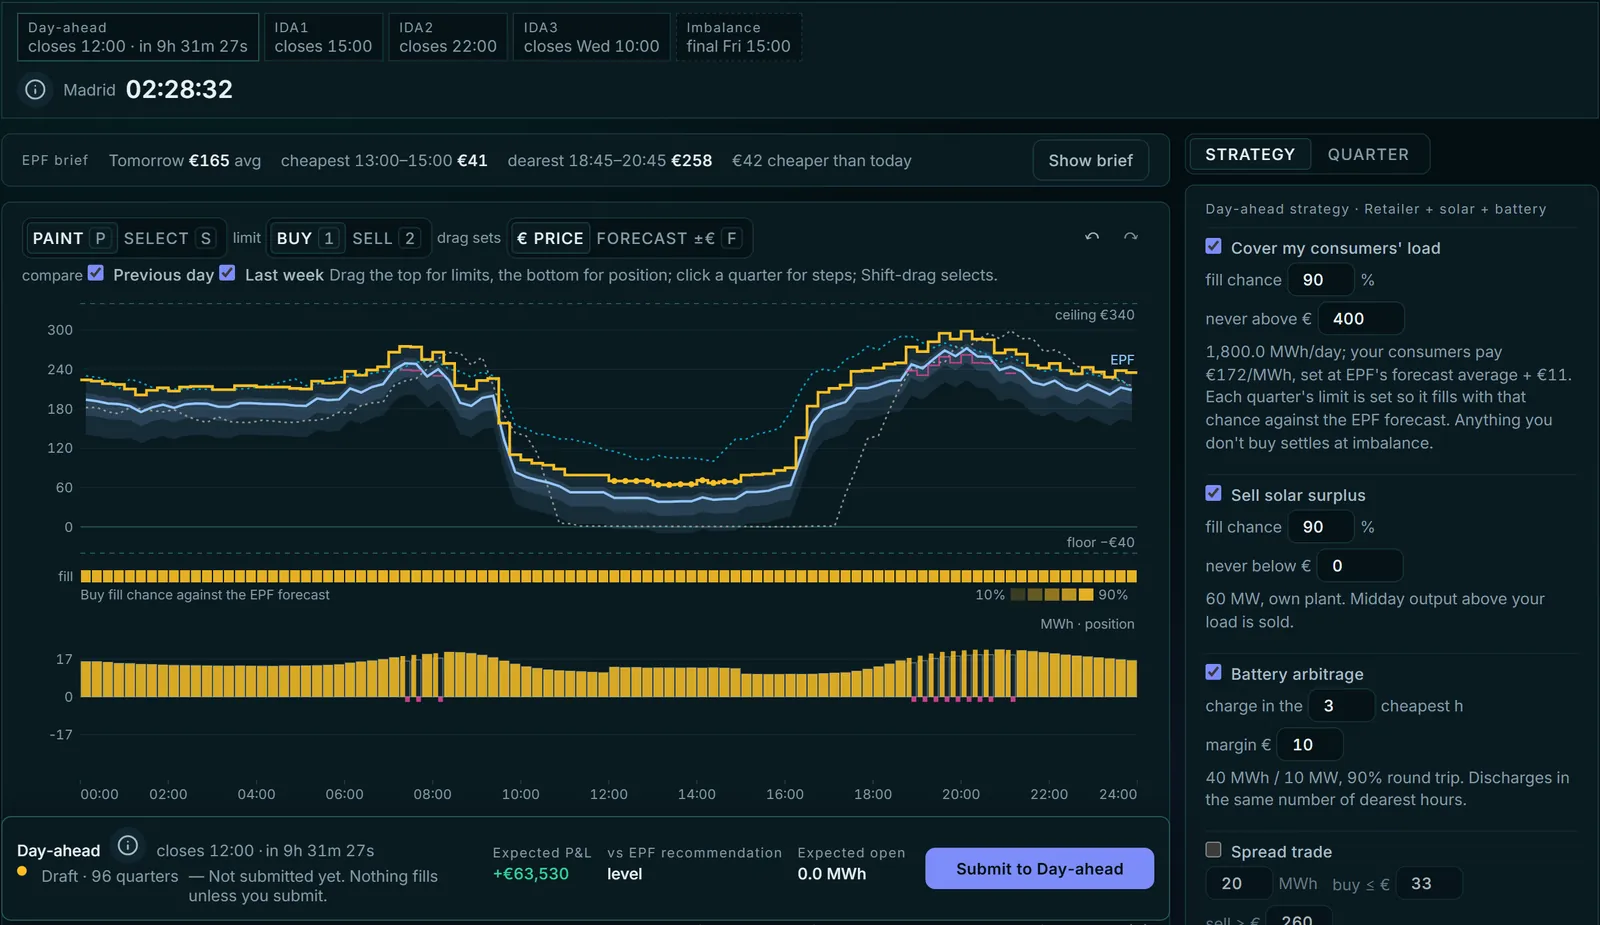
- A bidding tool on Spain’s day-ahead and three intraday auctions, at their real closing times.
- Start from EPF’s recommended bids for a retailer, a solar plant or a battery, then adjust.
- Every day settles on the real prices, so the forecast is judged in euros.
Tested on a year it never saw.
Every forecast is checked against the price that actually cleared, and against simple rules anyone could use for free.
The live record is published every day on Track record.
The rules of thumb we have to beat
- Same as yesterday
- Same day last week
- Average of the last 4 same weekdays
If a forecast cannot beat these, it is not worth paying for.
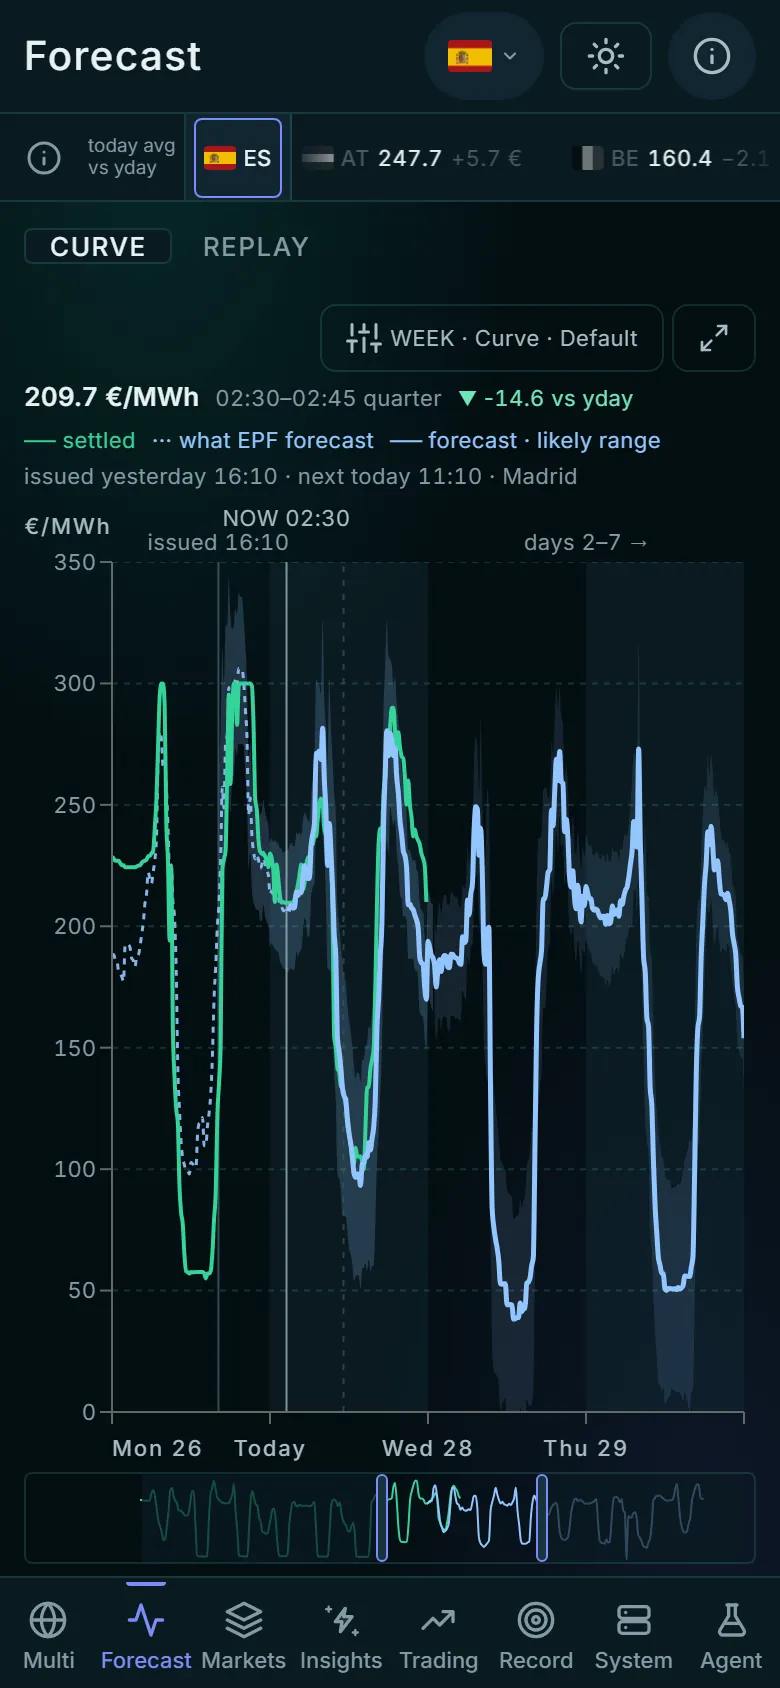
The whole app fits in your hand
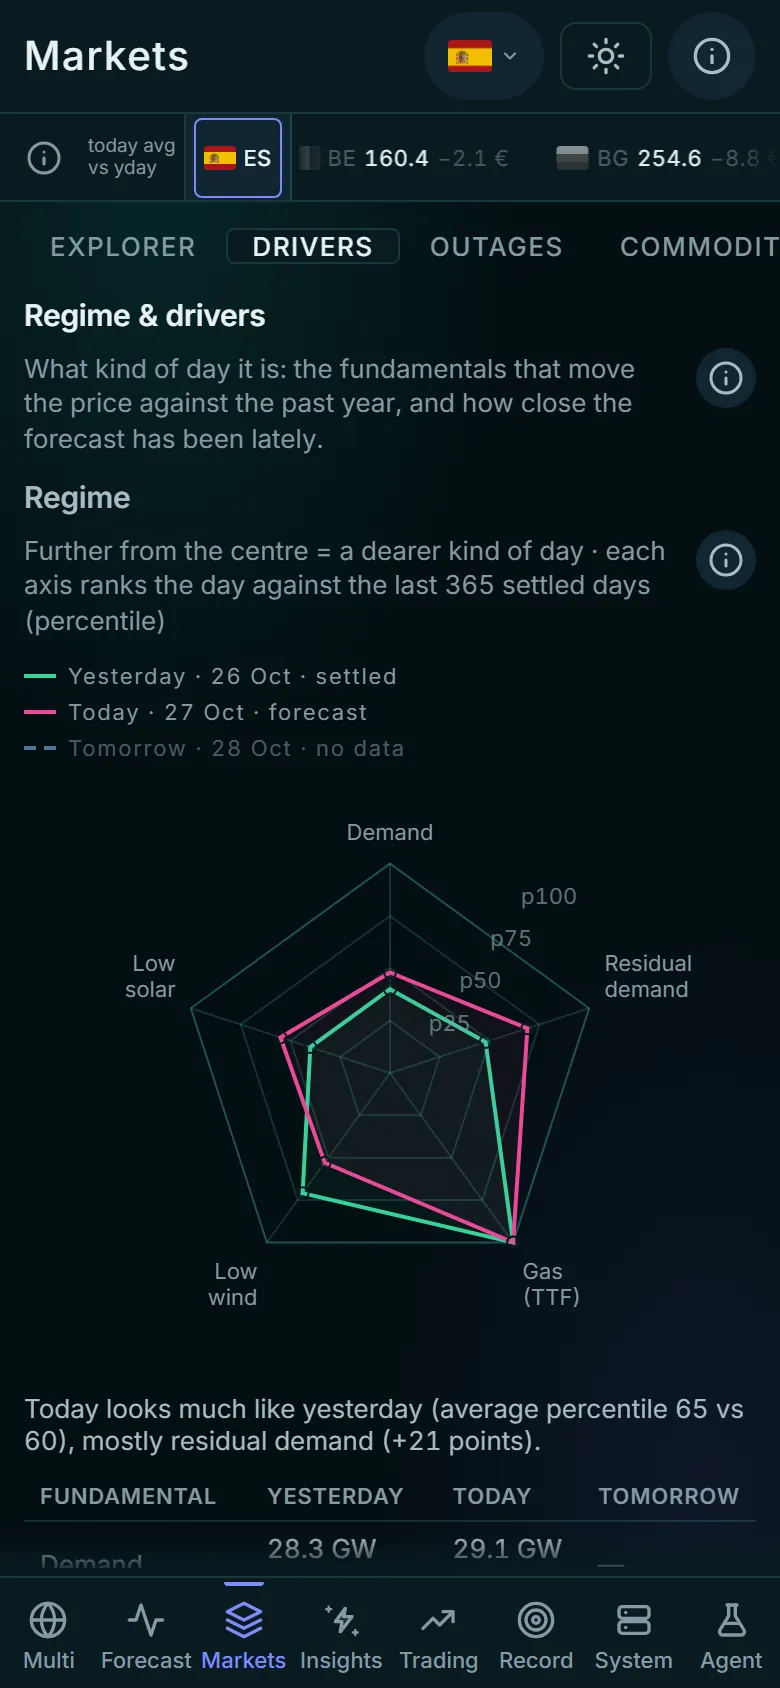
- Every section works on a phone, one full-screen pane at a time.
- Scrub a chart with a finger, or open the regime radar: is tomorrow tighter than today on demand, wind, solar and gas?
Put tomorrow’s price to work.
Free during beta. Tell us what you trade or run, and we will set you up.
- TradersDay-ahead and intraday, quarter by quarter.
- RetailersKnow tomorrow’s cost before the auction closes.
- Solar and batteriesCharge in the cheap hours, sell into the peak.
Thank you, your request is in.
We read every request and will reply by email. In the meantime, the app is open to everyone.
- Spain206.9 +5.1%
- Portugal207.3 +5.3%
- France161.5 +5.1%
- Germany155.1 +33.0%
- Italy North254.4 +1.7%
- Netherlands157.6 +11.1%
- Belgium160.4 −1.4%
- Austria247.7 +2.4%
- Switzerland244.3 +3.1%
- Poland162.6 −22.8%
- Czechia198.6 +2.5%
- Hungary241.3 −9.8%
- Romania255.5 −6.0%
- Greece224.8 −13.0%
- Denmark West92.3 +1.2%
- Norway Oslo107.0 +15.7%
- Sweden Stockholm12.0 +15.4%
- Ireland127.6 −23.8%
Day-ahead average on 27 October 2026, €/MWh, change on the day before