
Day-ahead (D+1)
Tomorrow’s quarter-hour prices, issued around 10:00 UTC, before the auction: what to bid.
No background in energy markets or software is assumed. Each section opens with a box of the words it uses; the glossary collects them all. Figures are as of 24 October 2026.
EPF predicts wholesale electricity prices in Spain, Portugal, France and Germany for every 15 minutes, up to seven days ahead. It publishes them in a web app and grades itself every day against the simplest possible predictions, so you can see exactly where it adds value.
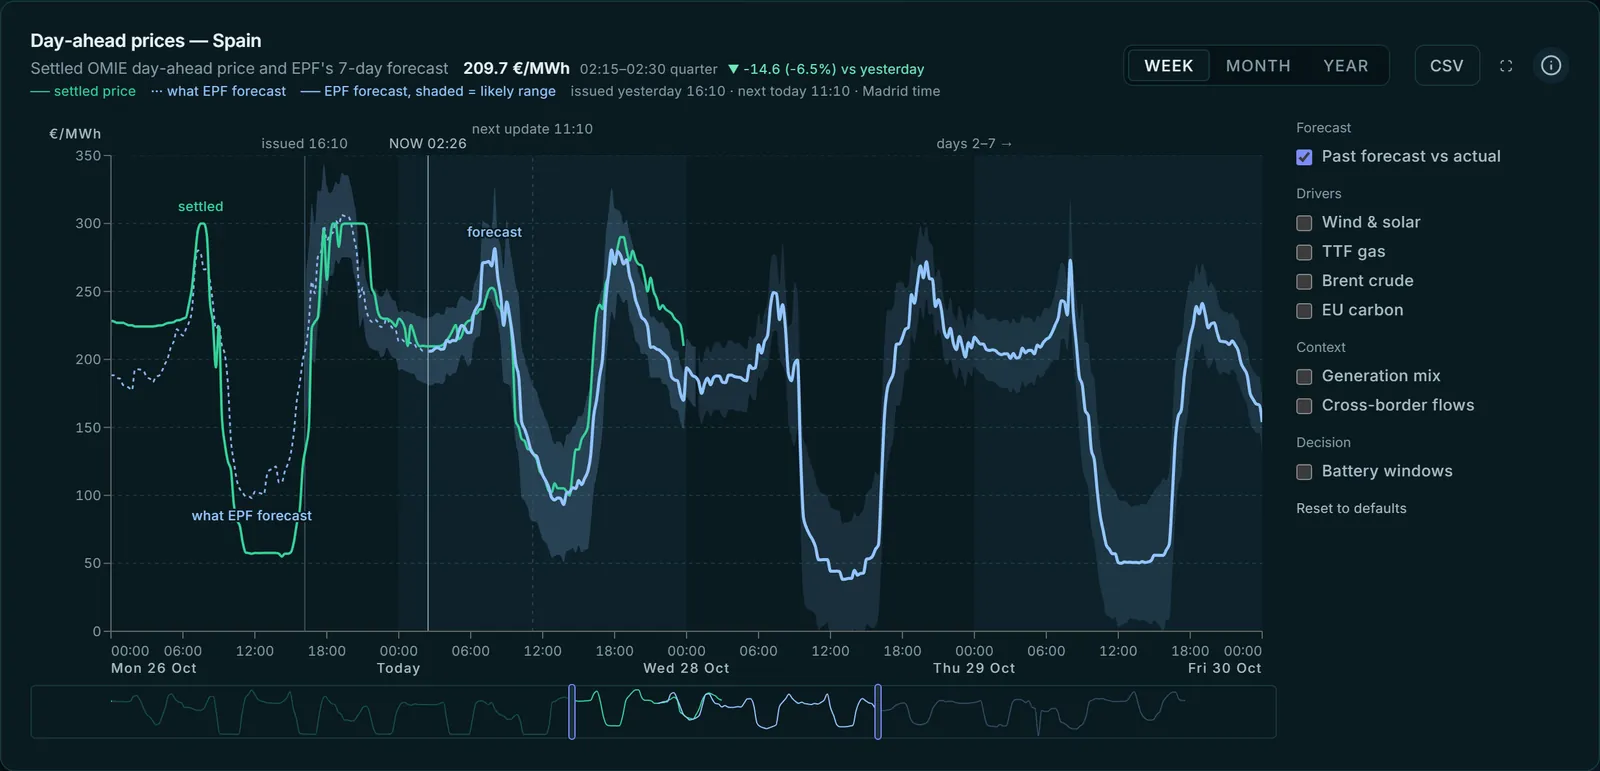
What it looks like: Spain's settled price in green, the forecast in blue with its likely range, a week ahead.
Electricity is mostly traded the day before it is used, and its price swings a lot within a day.
| When | Why the price moves |
|---|---|
| Sunny afternoons | More solar than anyone needs: the price can fall to zero or below |
| Calm, cold evenings | Little wind, high demand: the price climbs |
Retailers, solar and wind farms, battery operators and traders all want tomorrow’s prices before the auction.
Day-ahead (D+1)
Tomorrow’s quarter-hour prices, issued around 10:00 UTC, before the auction: what to bid.
Strategic (D+2 to D+7)
The six days after that, issued around 15:00 UTC, once tomorrow’s real prices are known: planning the week.
All four markets get both products, every day. For context, the app shows today’s prices for 45 European bidding zones (4 forecast).
What the models look at, all public:
One model family per market and product, each trained on its own market’s history. Each future quarter-hour is forecast directly from what is known at forecast time: no guess is fed back in, so an error on one day cannot snowball into the next.
More: Forecasting approach and What drives the model.
Prices repeat strongly day to day and week to week, so a forecast is worth something only if it beats those free rules. EPF shows the comparison everywhere it shows its own accuracy, including where it loses.
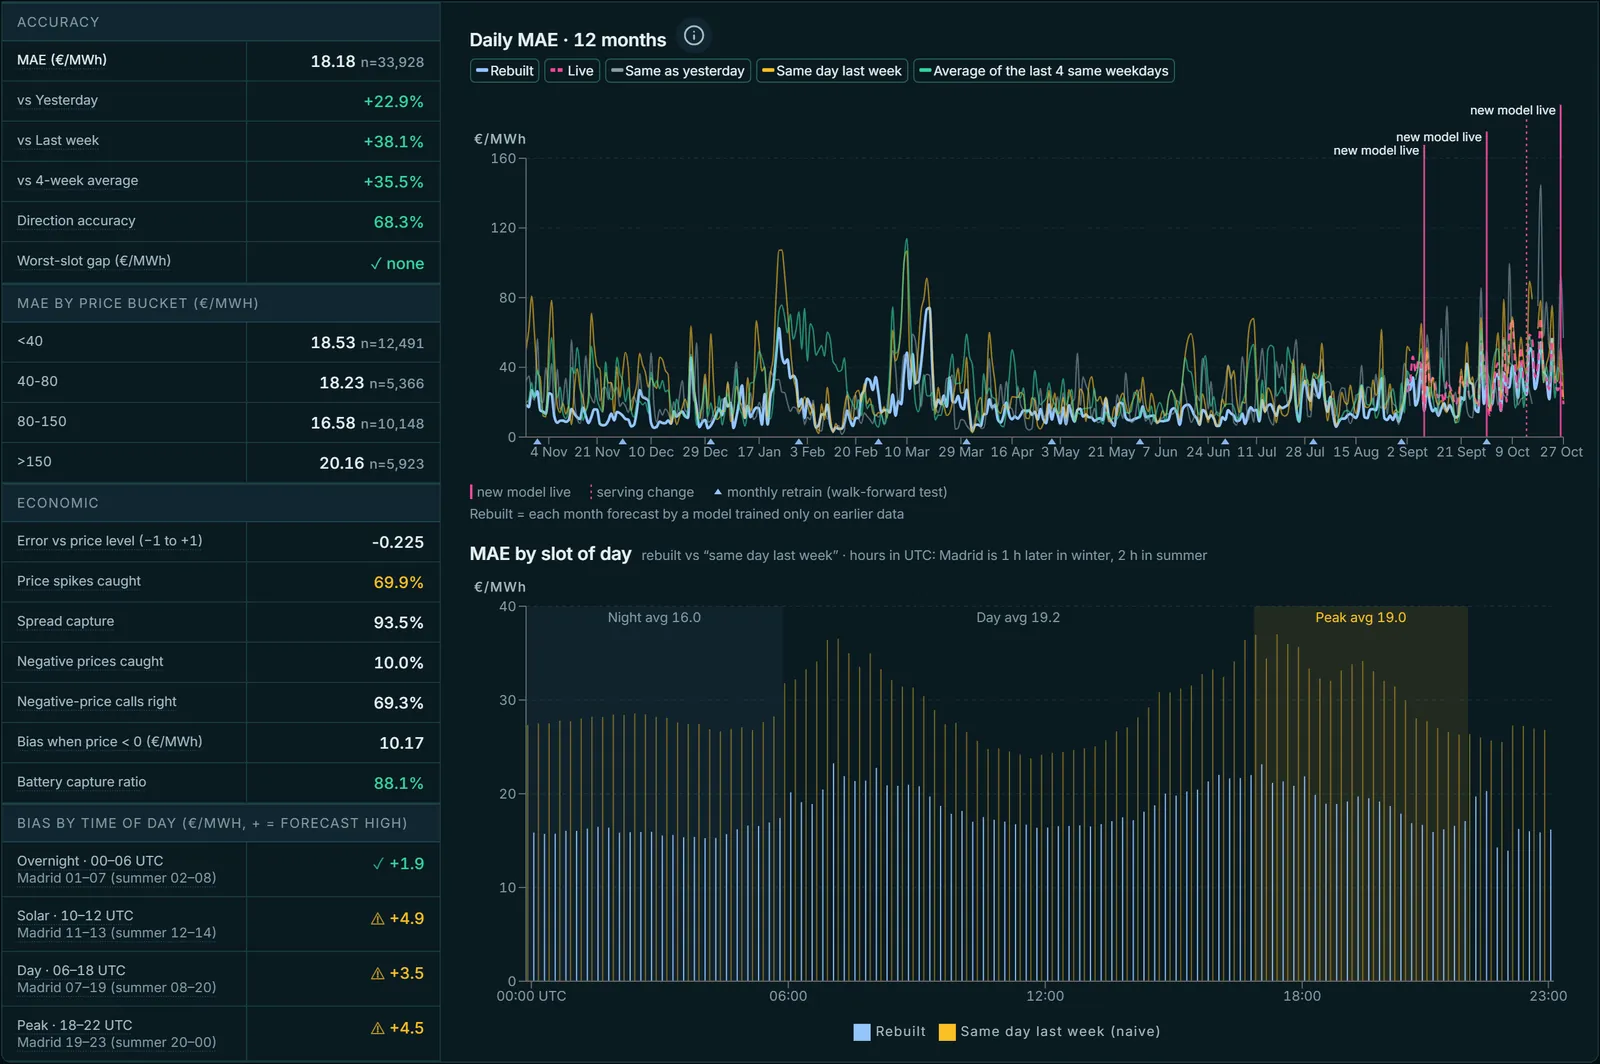
Spain's record in the app: error against each free rule, day by day. The app's window rolls daily, so its figures differ slightly from the table below.
Day-ahead, rolling 12 months, as of 2 Nov 2026, MAE in €/MWh. Positive means EPF beats the best naive baseline.
| Market | Walk-forward rebuild MAE | vs best naive | Live MAE | Live vs best naive |
|---|---|---|---|---|
| Spain | 14.83 | +37.9% | 35.21 | +3.4% |
| Portugal | 15.85 | +37.6% | 33.97 | −18.1% |
| France | 26.02 | +20.3% | 41.63 | −11.8% |
| Germany | 25.36 | +26.4% | 47.61 | −20.3% |
A low average error is not enough for a battery, so EPF also reports:
| Measure | What it says |
|---|---|
| Direction accuracy | How often the forecast is right about whether the price goes up or down from one period to the next |
| Spread capture | How much of the real gap between the day’s cheapest and dearest hours a battery would have earned following the forecast: money, not error |
Full figures, including the week-ahead product: Track record. The test: Walk-forward and baselines.
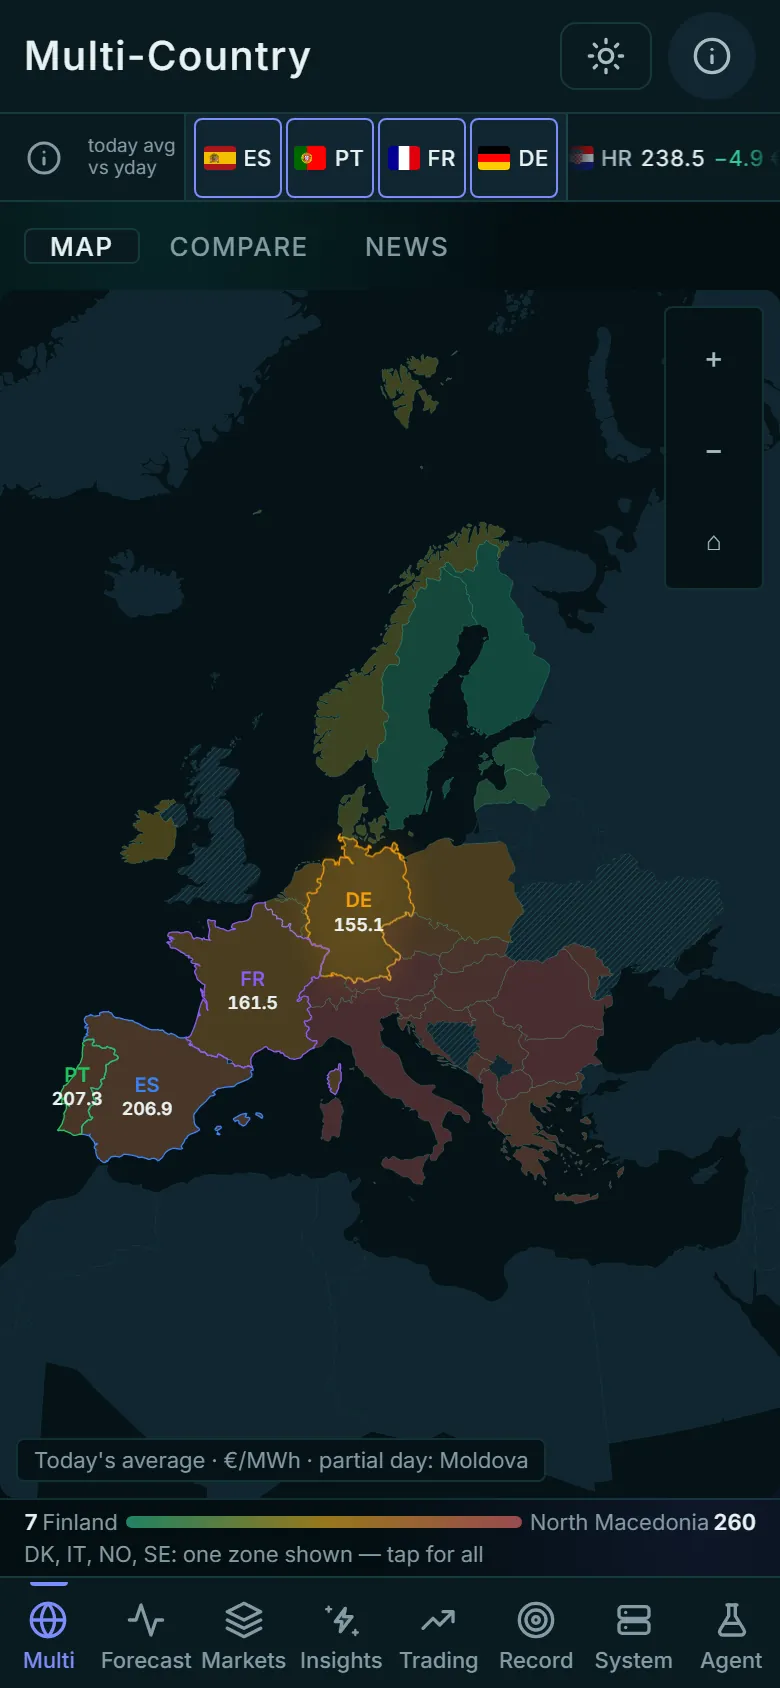
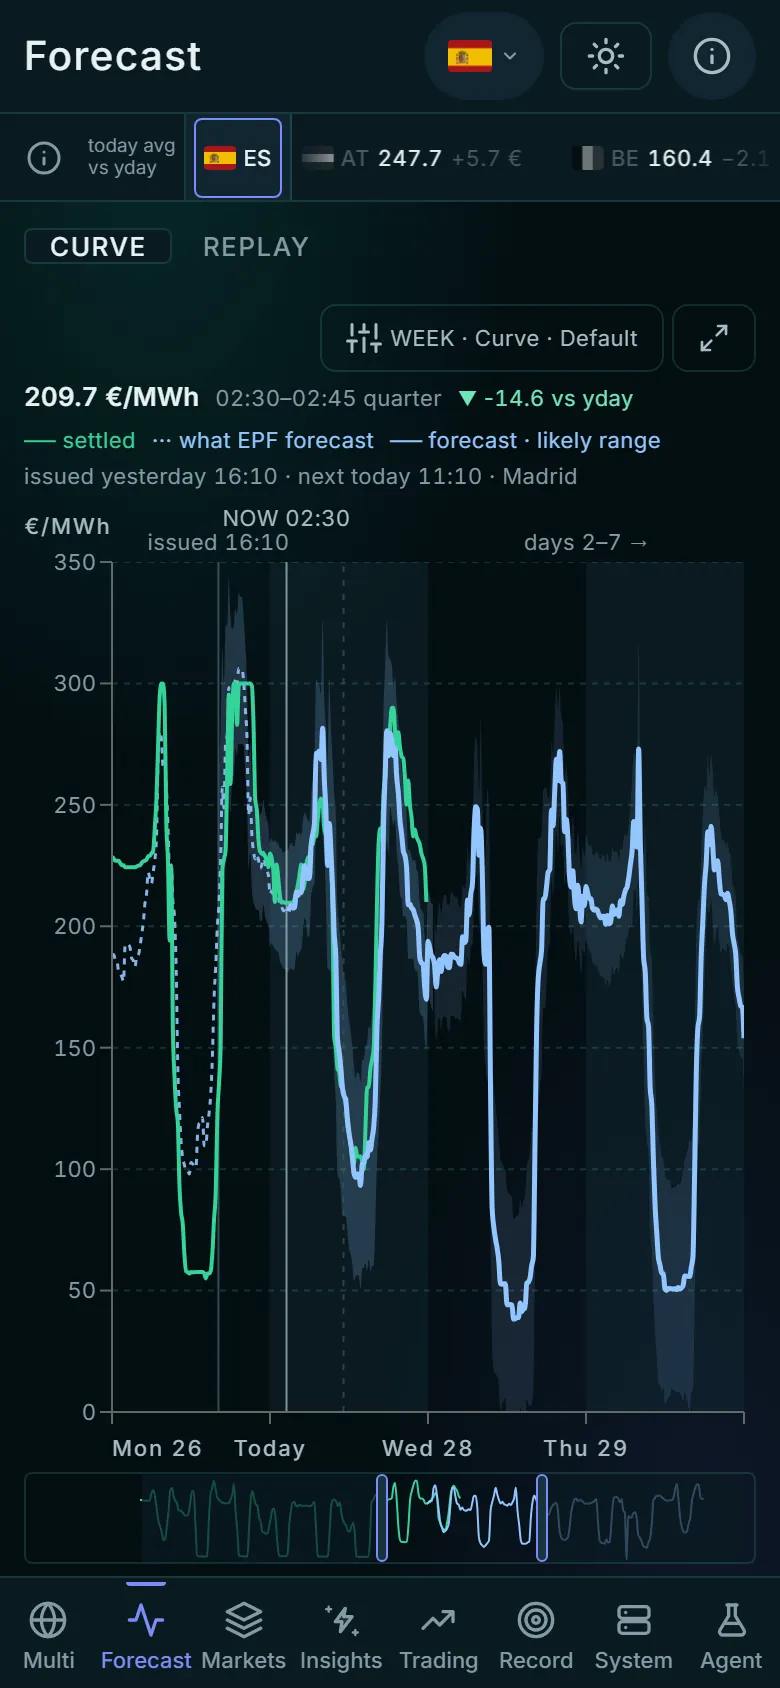
In menu order:
| Page | What it shows |
|---|---|
| Multi-Country | A map of Europe coloured by today’s average price, and the four forecast markets side by side |
| Today | A panel over any page: what moved since yesterday across Europe, your markets against their last week, the morning’s drivers and headlines |
| Forecast | One market’s price curve for the coming days with its uncertainty band, when it was issued and when the next lands, and How past forecasts held up |
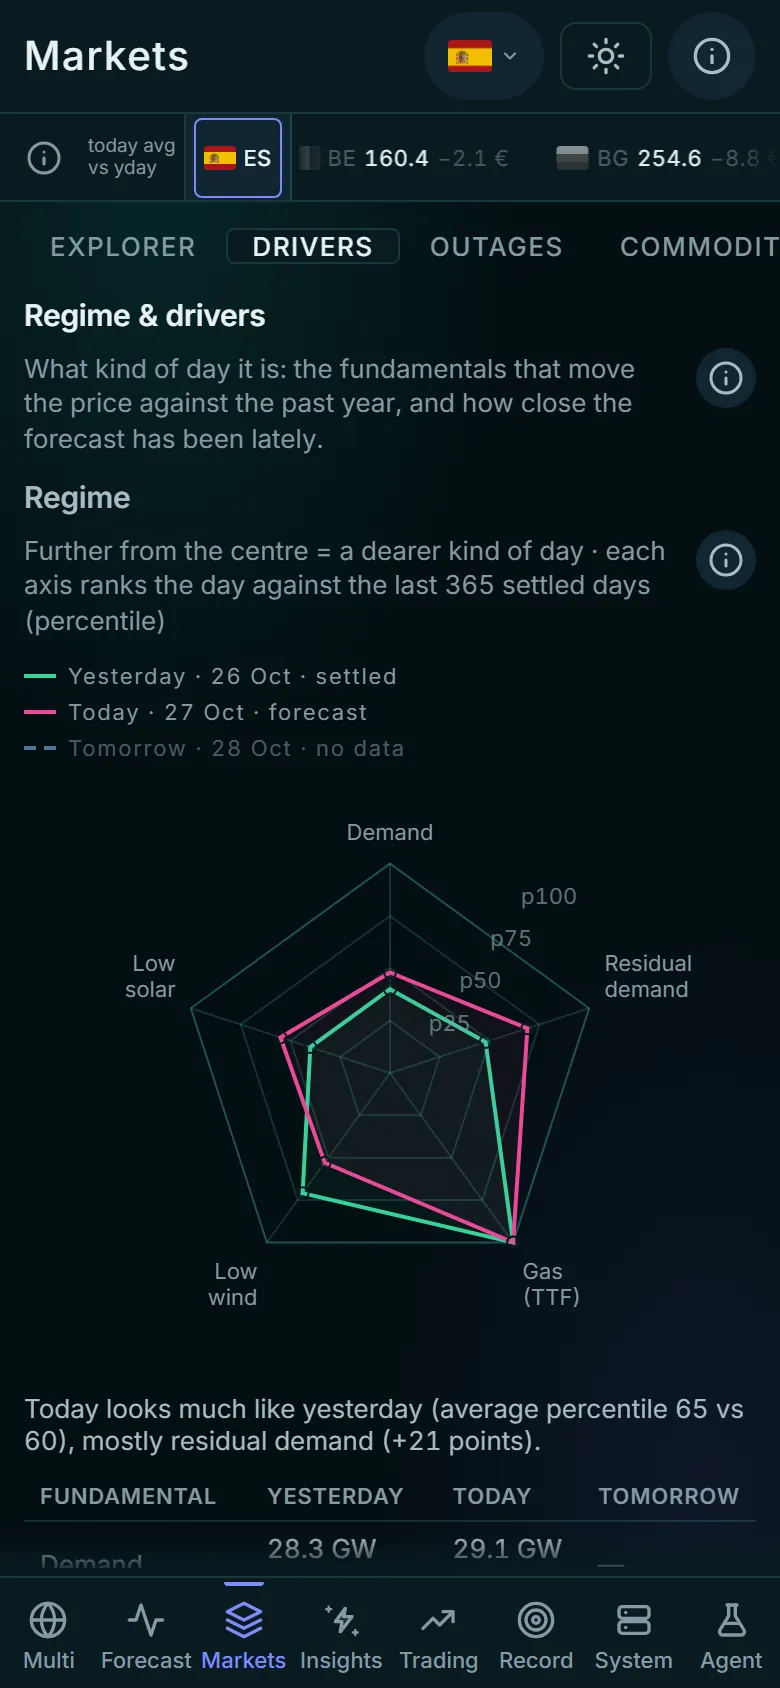
| Markets | Every Spanish market around the auction on one chart (forwards, day-ahead, intraday, imbalance), with Market context: the regime radar, outages, commodities, cross-border flows, the price continuum |
| Insights | A daily briefing per country, written by an AI language model and checked against the data before publication. It leads with the story (“In short”), then the figures and negative prices |
| Trading | Virtual bids into Spain’s real auctions at their real deadlines, settled at real prices beside EPF’s own recommendation. A first visit is four numbered steps and one button; Balance re-runs simulated traders since January |
| Track record | Accuracy against the naive baselines, in the walk-forward rebuild and live, month by month, with a marker on each day a new model went live |
| System | The health of every scheduled job and each market’s model |
| Research | The automated research pipeline’s findings (password-protected) |
Screenshots of each: Using the dashboard.
The full interactive picture: the architecture page.
| When (UTC) | What happens |
|---|---|
| Through the day | Collectors refresh grid, weather and fuel data, pausing around the forecast runs |
| Morning | Tomorrow’s official renewable forecast is collected; the day-ahead models need it |
| About 10:10–10:25 | Day-ahead forecasts for Spain, Portugal, France and Germany, a few minutes apart, each writing tomorrow’s quarter-hours |
| Shortly after | The app’s stored copies refresh and the first-screen snapshot is republished |
| 11:00 | The daily market briefing (a PDF) is produced |
| 12:00 Madrid | The auction gate closes; results are collected soon after and the day-ahead forecast is scored |
| About 15:10–15:25 | Strategic forecasts (D+2 to D+7), then the same refresh |
| Late afternoon | The written Insights briefing for each country |
| Night | Scores and naive baselines recomputed, data backed up, a daily health snapshot recorded |
Every scheduled job records whether it succeeded and how much it wrote. A job that writes nothing counts as a failure, and the System page shows it.
An automated research pipeline proposes experiments, runs and scores them, and records what it learned. It never changes production by itself. A candidate is offered for promotion only if it:
A person approves every promotion. Afterwards the live forecast is checked to confirm the model gets the same inputs in production as in testing. That check is in place for Spain and Portugal and is being extended to France and Germany, where some inputs still arrive blank.
| Term | Meaning |
|---|---|
| API | The server’s front door for data. |
| Cloud batch job | A program the cloud runs on demand for a few minutes. |
| D+1 … D+7 | Tomorrow … a week ahead. |
| Database | Where the data, forecasts and scores are stored. |
| Day-ahead market | The daily auction that sets tomorrow’s prices. |
| Direction accuracy | How often up and down moves are called right. |
| €/MWh | Euros per megawatt-hour, the unit of the price. |
| Experiment | One idea tested against the current model. |
| Gate | The deadline to submit bids. |
| Gradient-boosted trees | The model type: many small decision trees, each correcting the last. |
| Imbalance price | The settlement price for what is still wrong at delivery. |
| Inputs | The facts a model looks at. |
| Intraday auctions | Later auctions to adjust positions after the day-ahead one. |
| Live | The forecasts actually published each day. |
| MAE | The average size of the forecast error. |
| Model | A program that learned a pattern from examples. |
| Naive baseline | A free rule of thumb to beat. |
| Promotion | Putting a better model live. |
| Quarter-hours | The 15-minute periods the market prices separately. |
| Regime radar | Tomorrow’s fundamentals compared with the past year. |
| Scheduled job | A task that runs on a timetable. |
| Server | An always-on computer rented in the cloud. |
| Sign test | Checking a win count is too lopsided to be luck. |
| Snapshot | A small file for an instant first screen. |
| Spread capture | The share of the daily price gap a battery would earn. |
| Training | Teaching a model on past data. |
| Uncertainty band | The likely range around the forecast. |
| Walk-forward rebuild | The past forecast again: each month by a model that never saw it. |
More metric definitions: Evaluation metrics.