
Using the dashboard
The app is at epf.productjorge.com, on desktop and phone. Every picture below is the live app; click its address bar to open that page.
| Start here | How |
|---|---|
| Pick markets | The country strip at the top. The first one is the primary market, which most sections follow. |
| Share a view | The selection lives in the URL, so a shared link opens the same markets. |
| Phone menu | Multi, Forecast, Markets, Insights, Trading, Record, System, Agent. |
Multi-Country
Section titled “Multi-Country”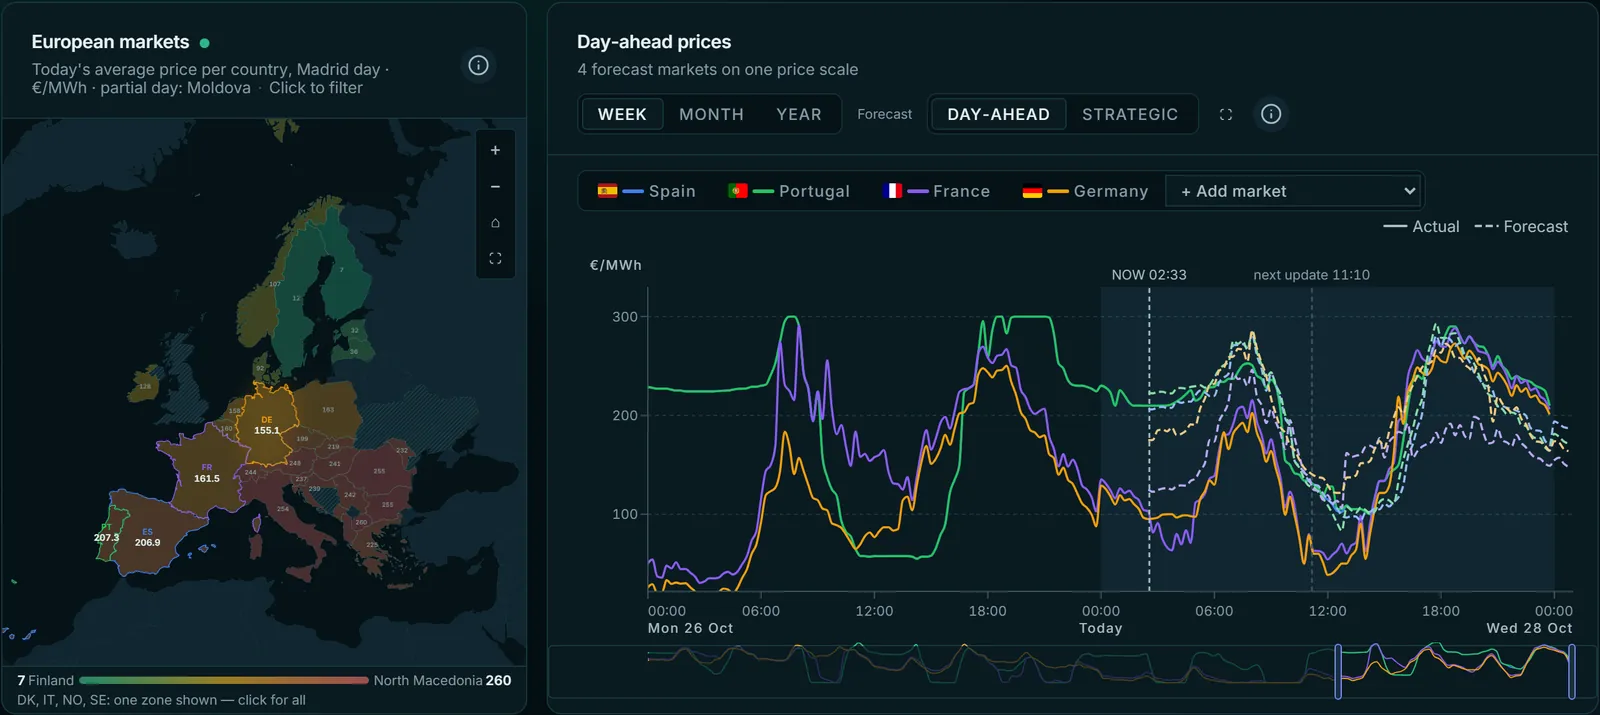
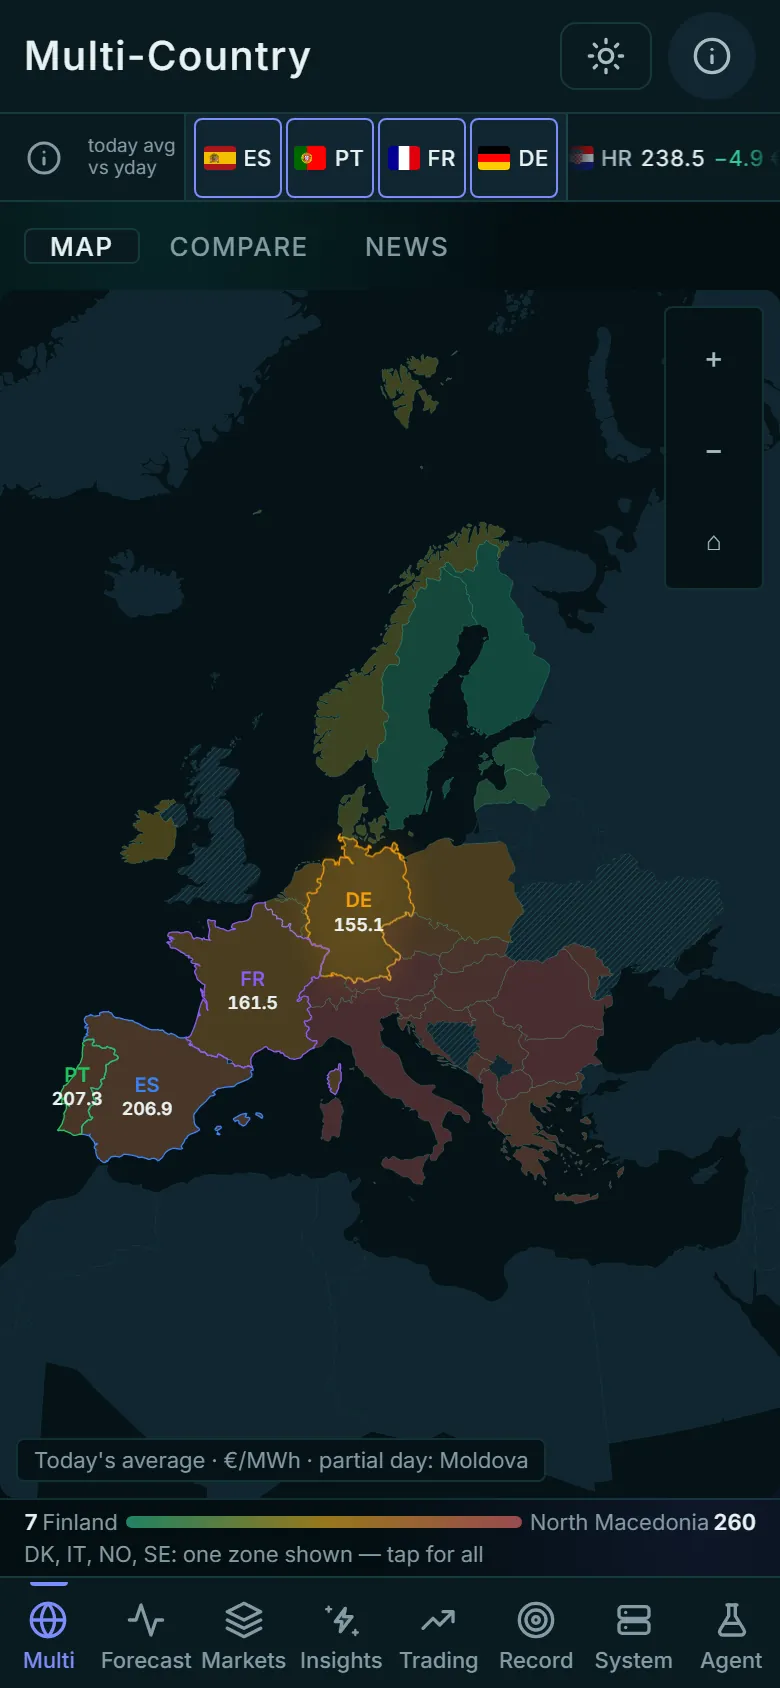
The home page: Europe by today's average price, the four forecast markets beside it.
- Map: 45 European bidding zones (4 forecast), coloured by today’s average day-ahead price.
- Compare: several markets’ prices and forecasts on one chart, from days to a year.
- News: the most market-moving headlines, with a sentiment score.
- Below the chart, a short briefing gives tomorrow’s call for each of the four markets.
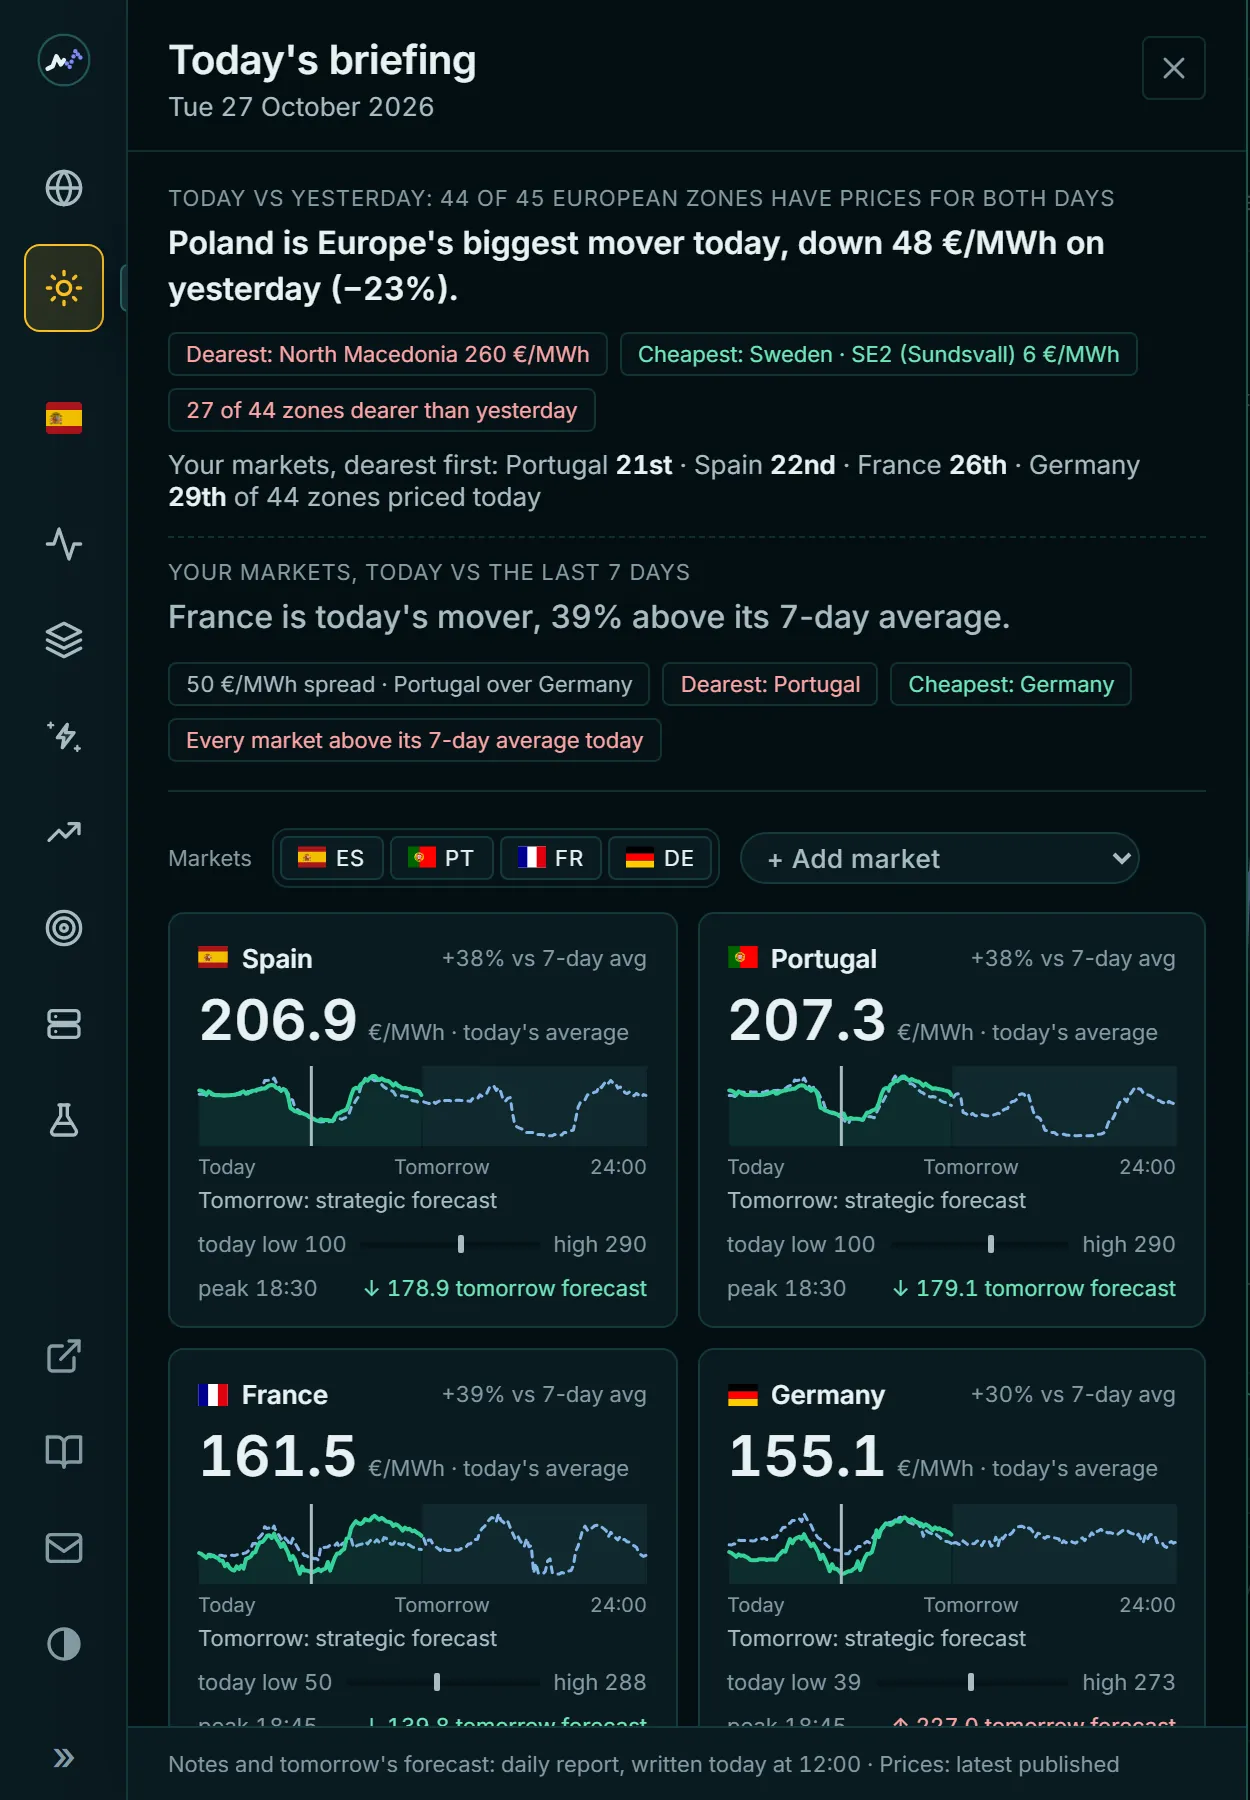
The amber Today button (a sun on a phone) opens the daily briefing over any page.
- Today against yesterday, across all 45 European zones.
- Your markets against their last seven days.
- The morning read: drivers and headlines, with sentiment, one market at a time.
+ Add market adds any European zone. It opens by itself at most once a day.
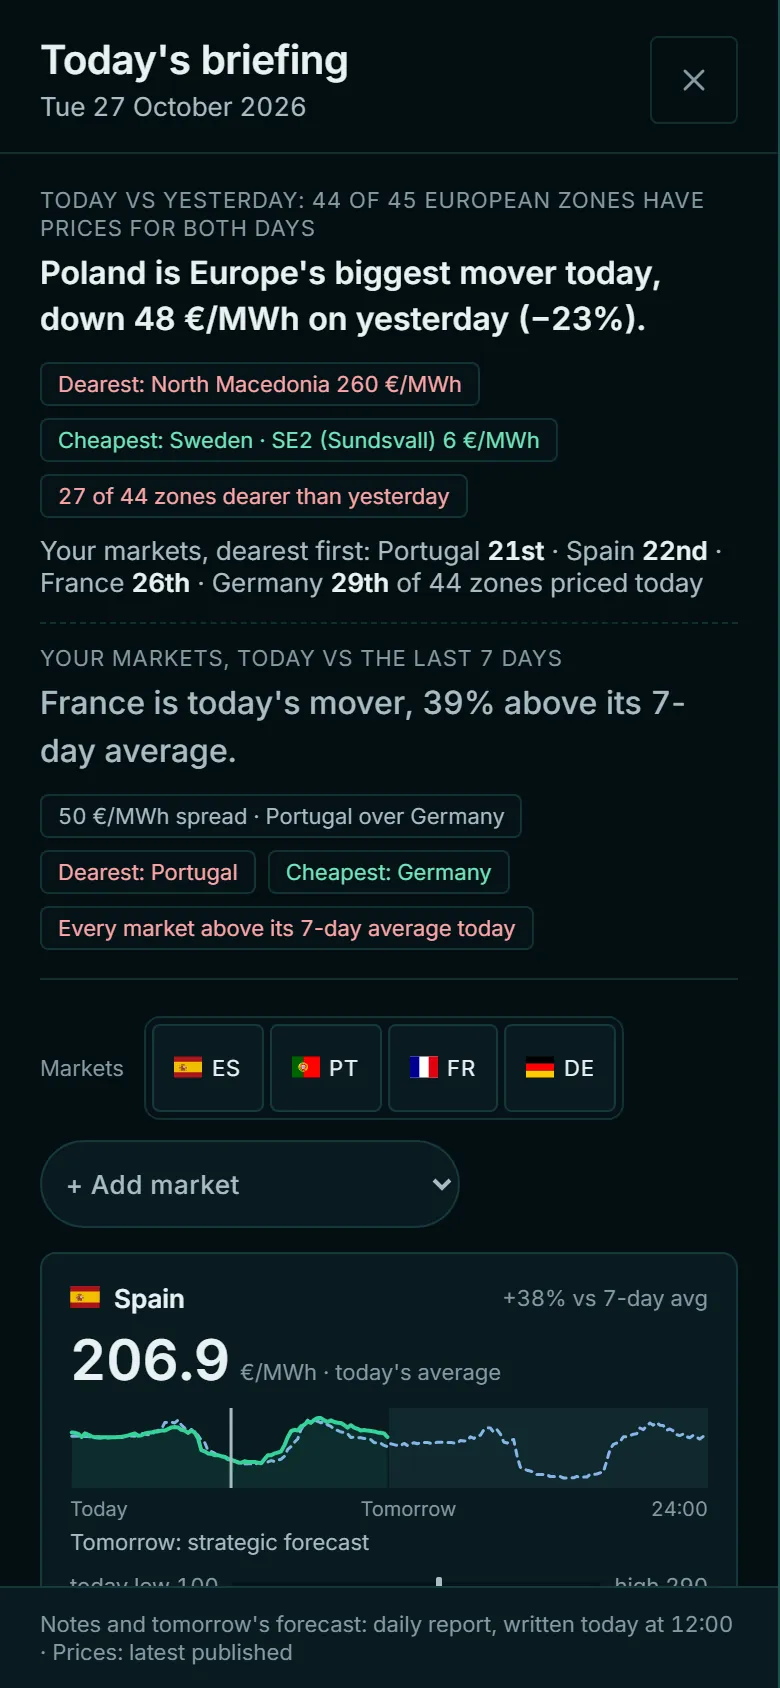
On a phone the sun icon in the header opens the same briefing full screen; scroll it for the other markets and the morning read, and close it with the cross.
Forecast
Section titled “Forecast”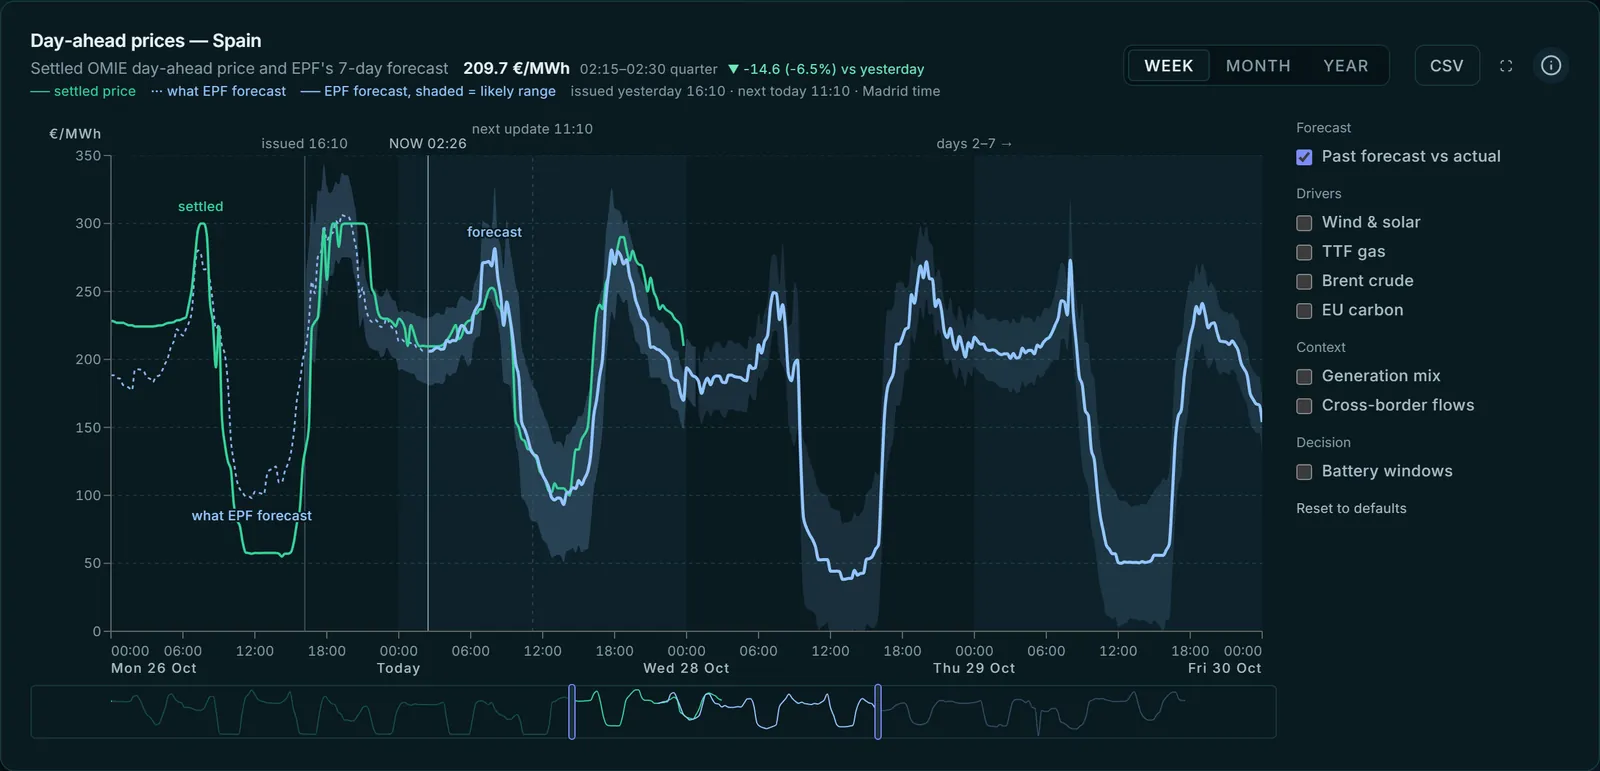
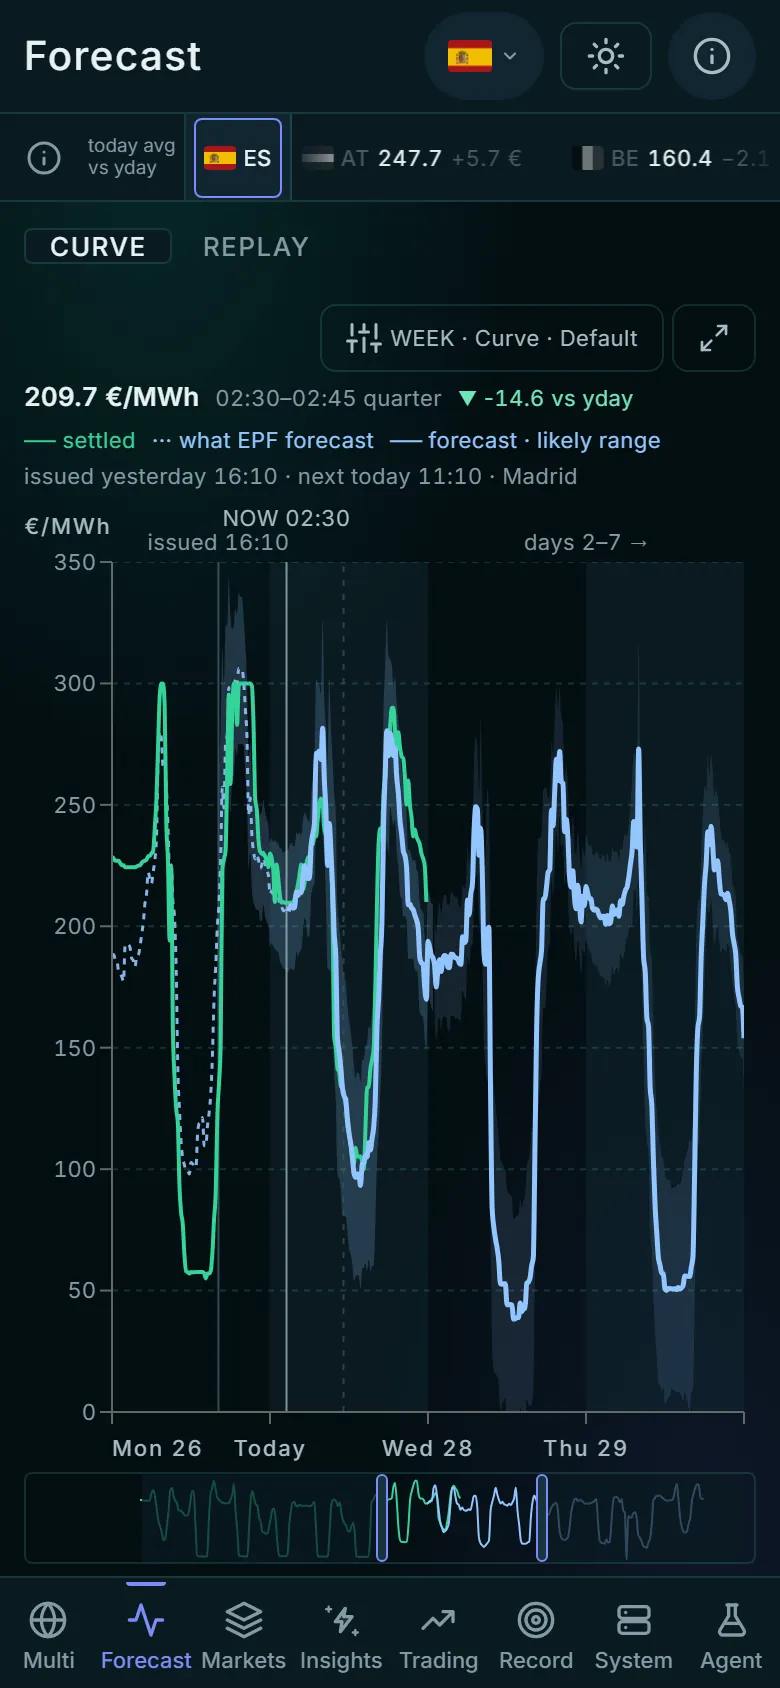
Spain's Curve: settled price, tomorrow's day-ahead forecast and six more days, with the likely range shaded.
The key names each line in words and says, in Madrid time, when this forecast was issued and when the next one lands. The band is the typical error for each time of day (Reading the uncertainty band).
| Also on this page | What it adds |
|---|---|
| Layers | Weather, gas, carbon and oil, the generation mix, cross-border flows |
| Table view | Prices hour by day |
| How past forecasts held up (Replay on a phone) | Each earlier forecast of the same delivery day against what settled, and yesterday’s forecast against the real price |
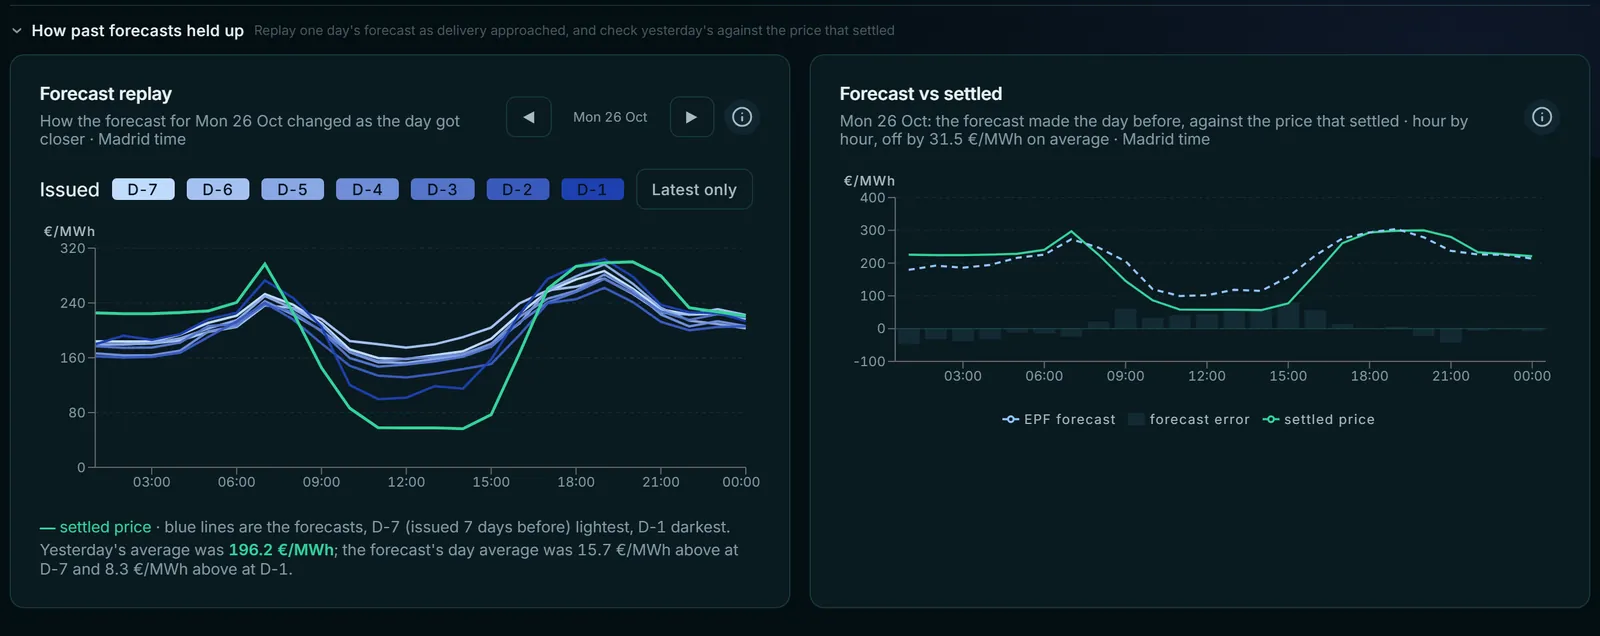
How past forecasts held up, opened: how one day's forecast firmed up over the week before, and yesterday's forecast against the price that settled.
Markets
Section titled “Markets”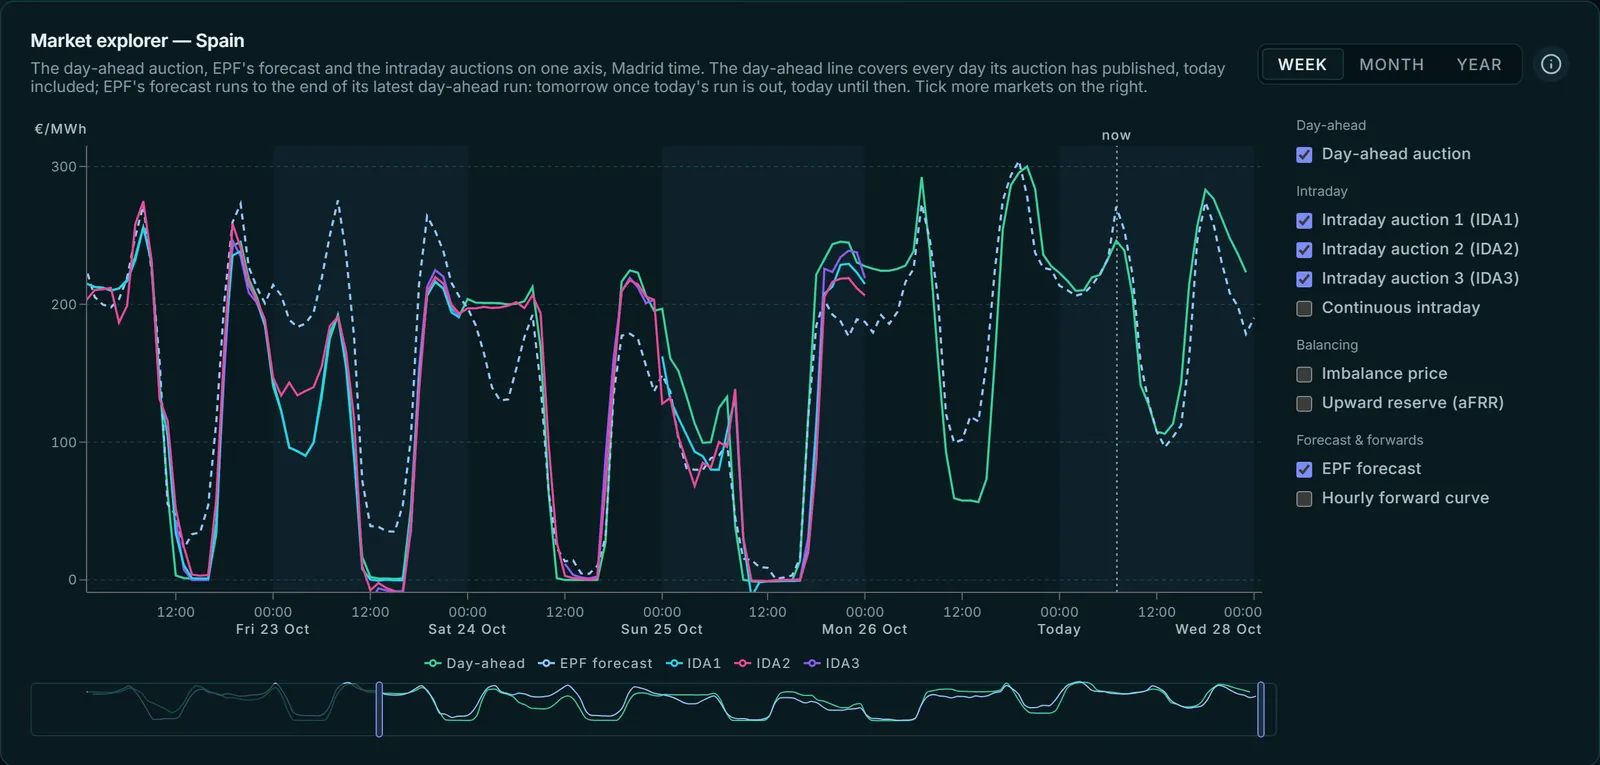
The Explorer: day-ahead, the three intraday auctions and EPF's forecast on one axis.
The Explorer draws forwards, day-ahead, intraday and balancing prices on one axis, past and forecast. Its picker names each market in words (intraday auction 1, continuous intraday, imbalance price and so on).
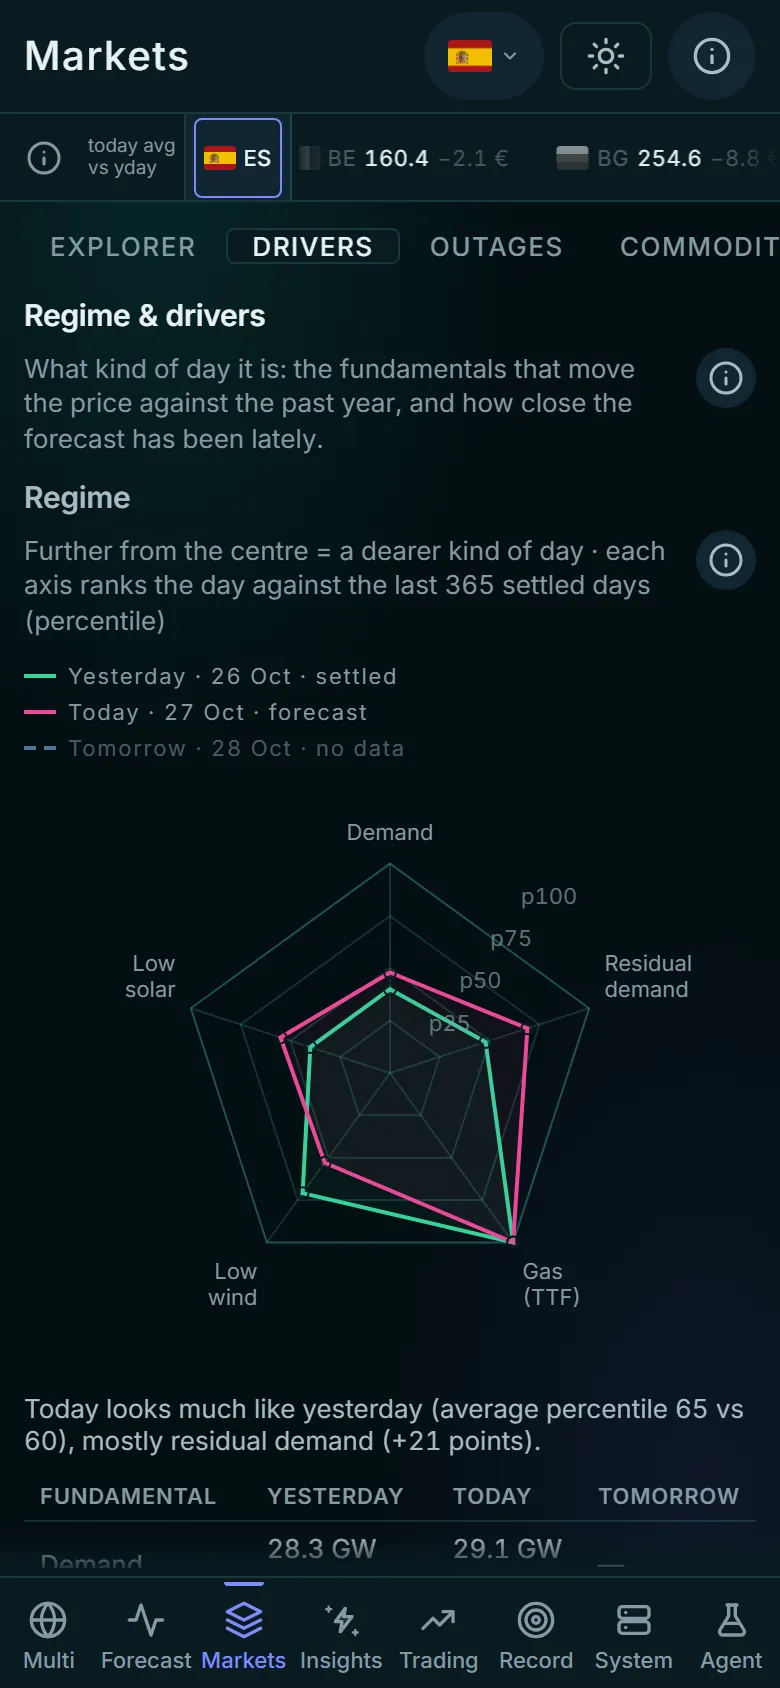
Market context, below the Explorer, holds the rest, one tab at a time:
- Regime & drivers: the regime radar scores yesterday, today and tomorrow on demand, residual demand, gas, wind and solar against the past year.
- Outages & signals: unavailable plants and lines, and price gaps worth a look.
- Commodities (gas, oil, carbon) and Cross-border flows.
- Price continuum: one delivery window priced at each stage, forwards to imbalance.
On a phone: Explorer, Drivers, Outages, Commodities, Flows and Continuum panes.
Insights
Section titled “Insights”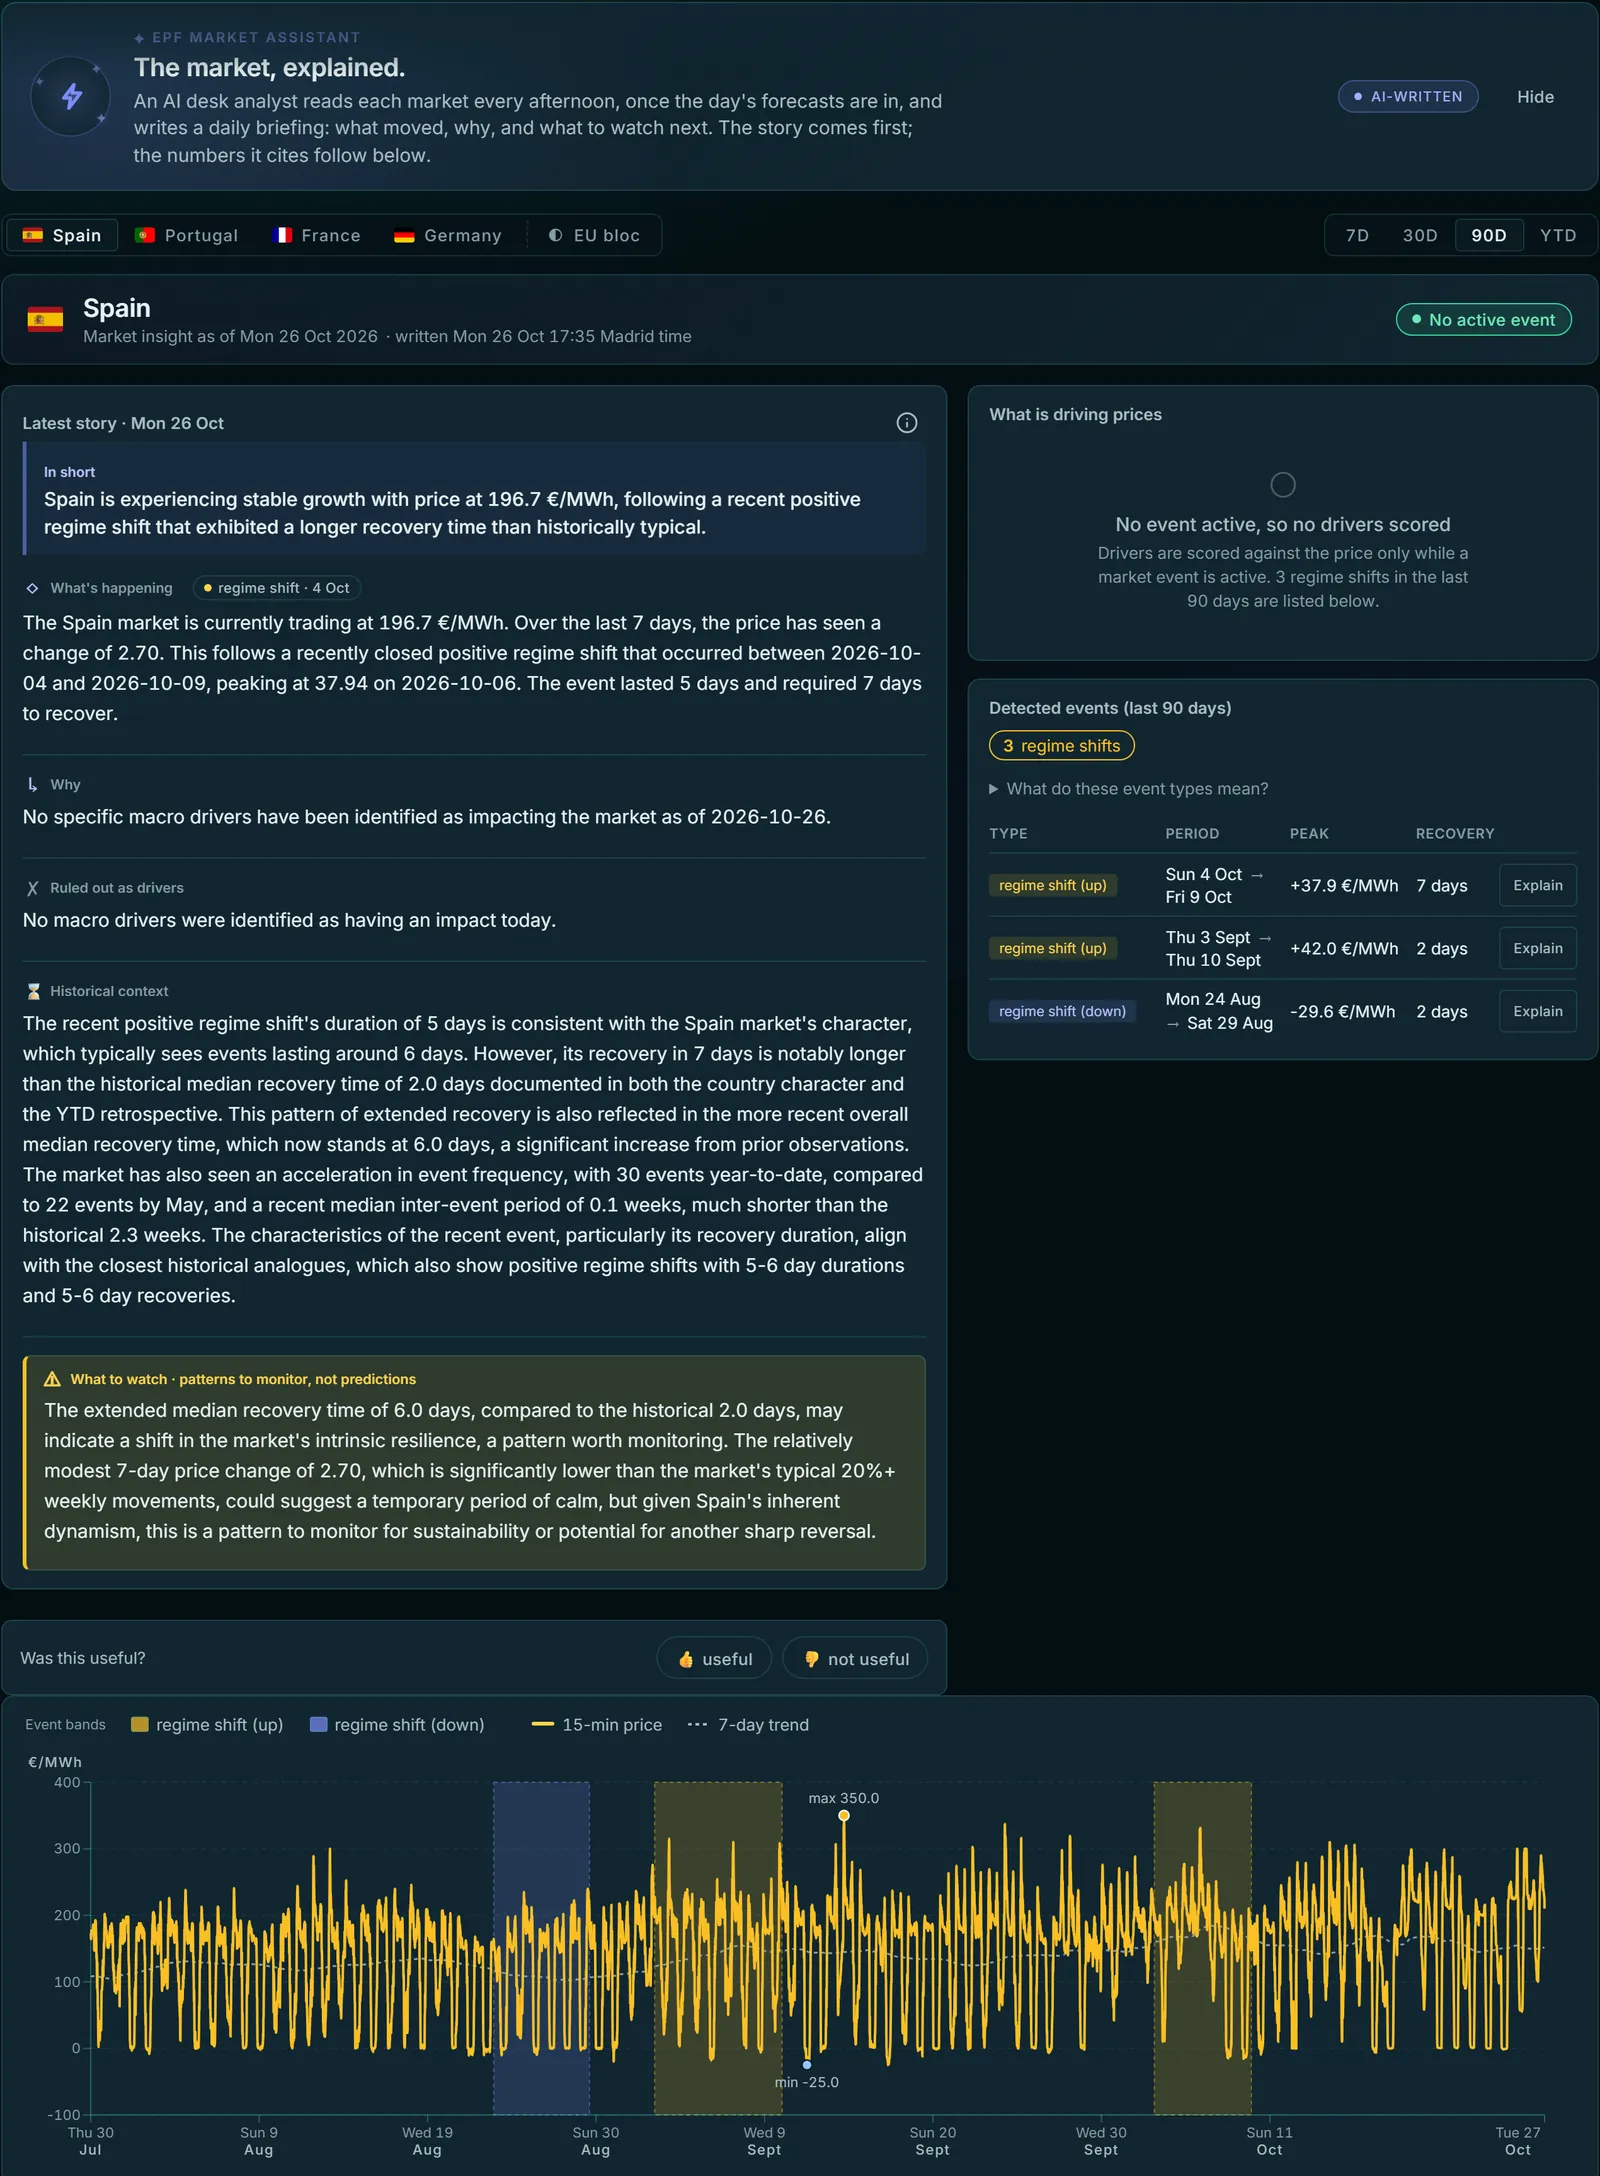
A daily briefing per country, written by a language model and checked against the data before publication.
It leads with the story: In short, then what happened, why, and what to watch, with the drivers and detected events beside it. The price chart and dated figures follow.
| Tab | Shows |
|---|---|
| Numbers, Drivers, History | What is behind the story |
| Negative | Negative prices in the four markets over the period, and when in the day they fell |
| EU bloc | When the markets move together |
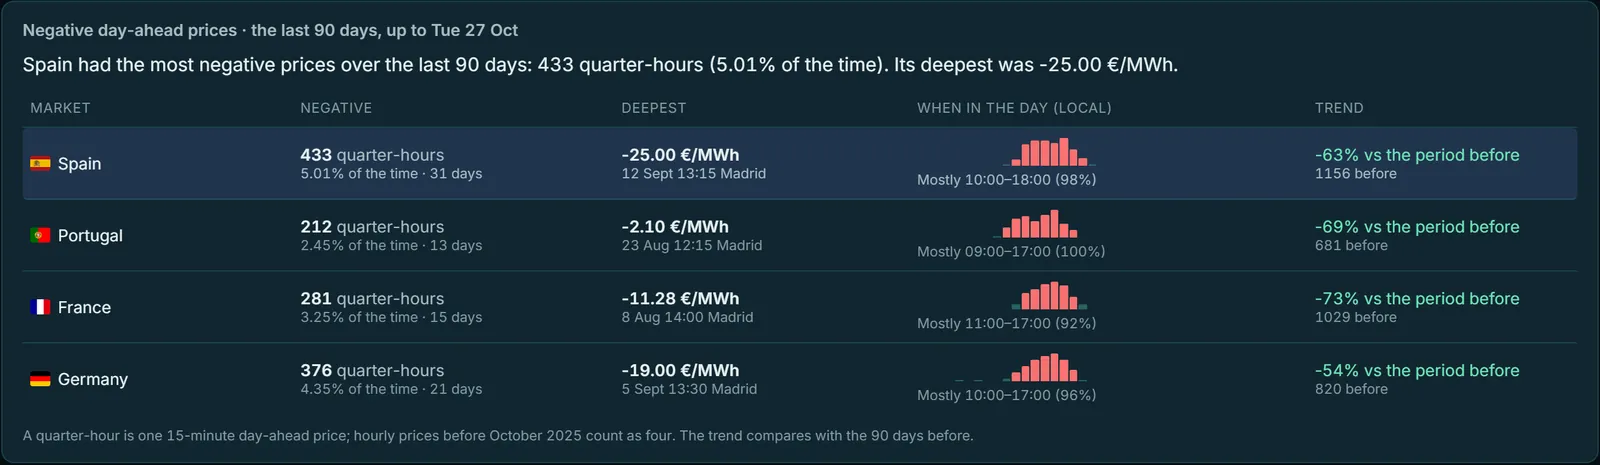
Negative prices on desktop: one row per market, with the deepest price and when in the day they fell.
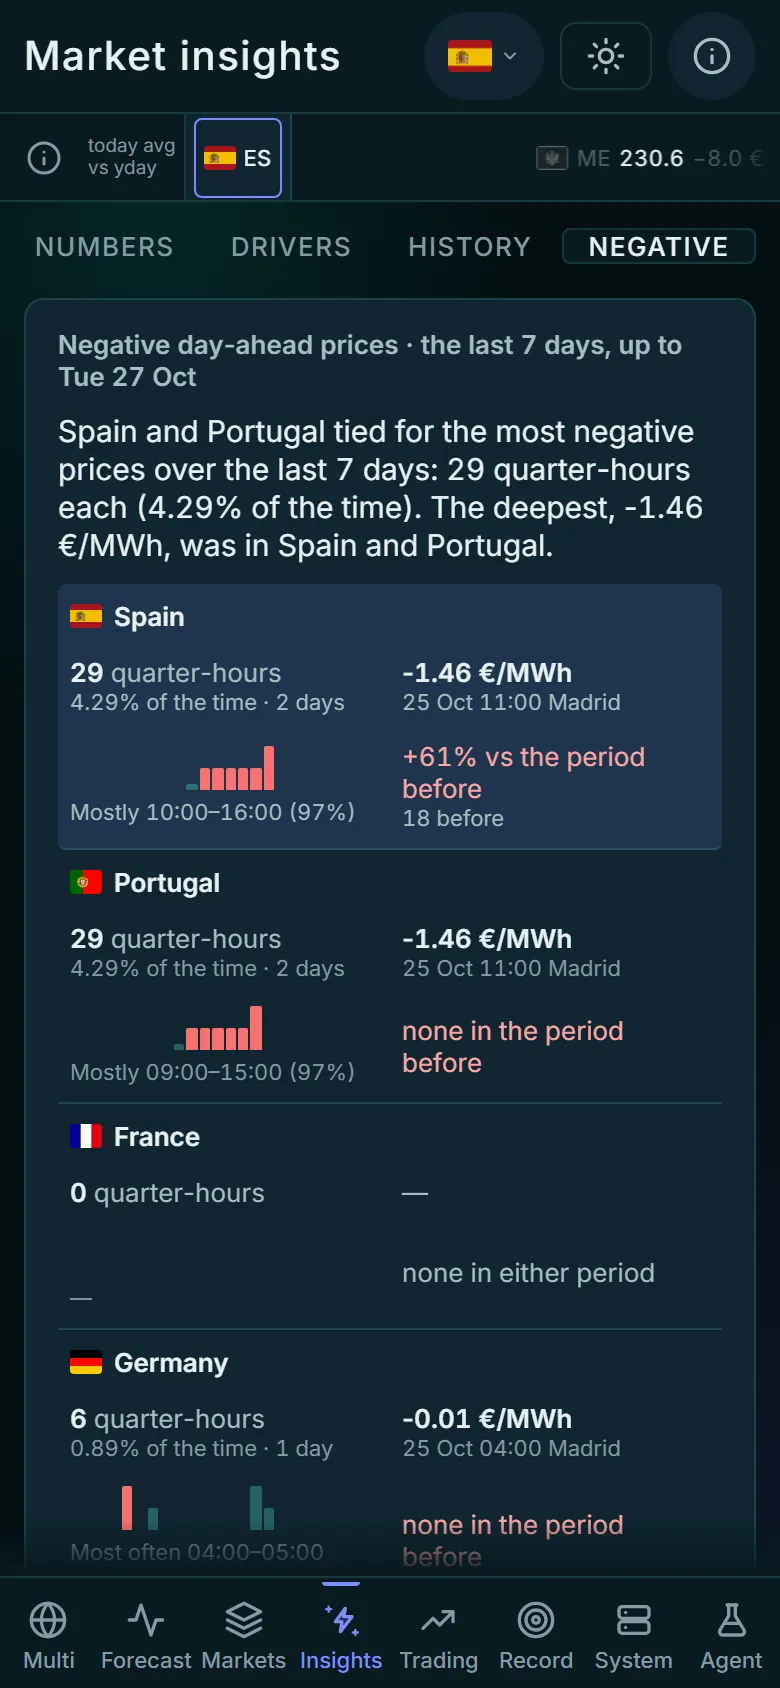
The Negative summary counts the quarter-hours each market spent below zero over the chosen period, up to tomorrow, gives the deepest price and its time, and shows when in the day they fell. Each market is compared with the same length of time before. On a phone it is its own pane, one card per market.
Trading
Section titled “Trading”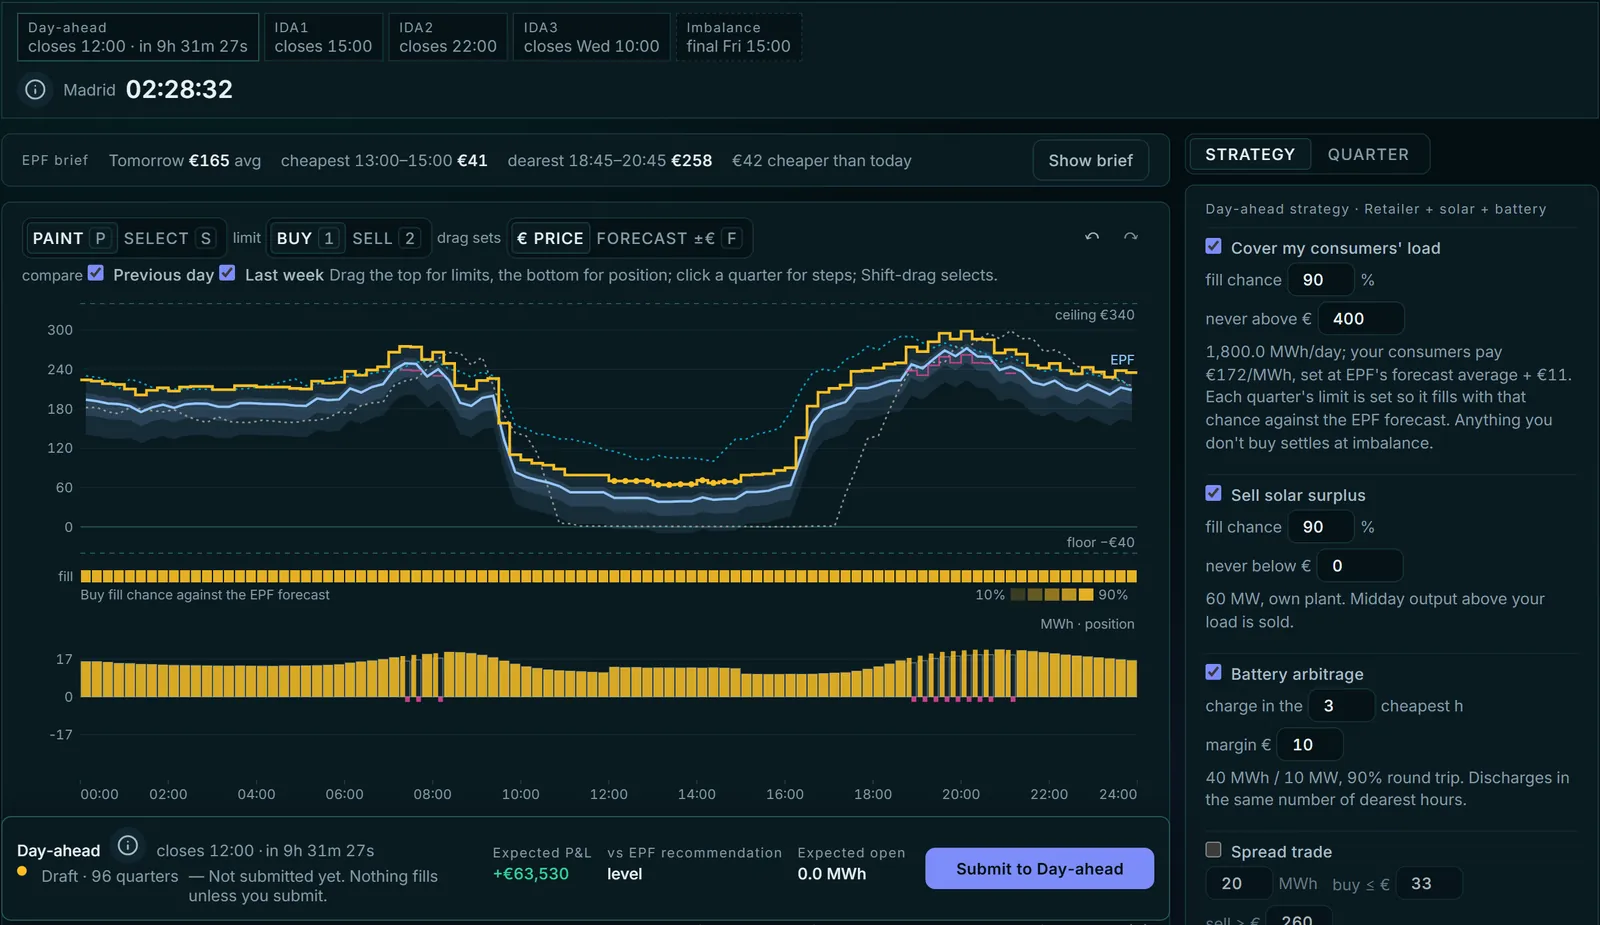
Live: a virtual portfolio's day-ahead bid, quarter by quarter, before the auction closes.
A bidding tool on Spain’s real markets. Bid a virtual portfolio into the day-ahead auction and the three intraday auctions before each real closing time; late bids are refused. It settles on the real imbalance price, beside EPF’s recommendation executed unchanged.
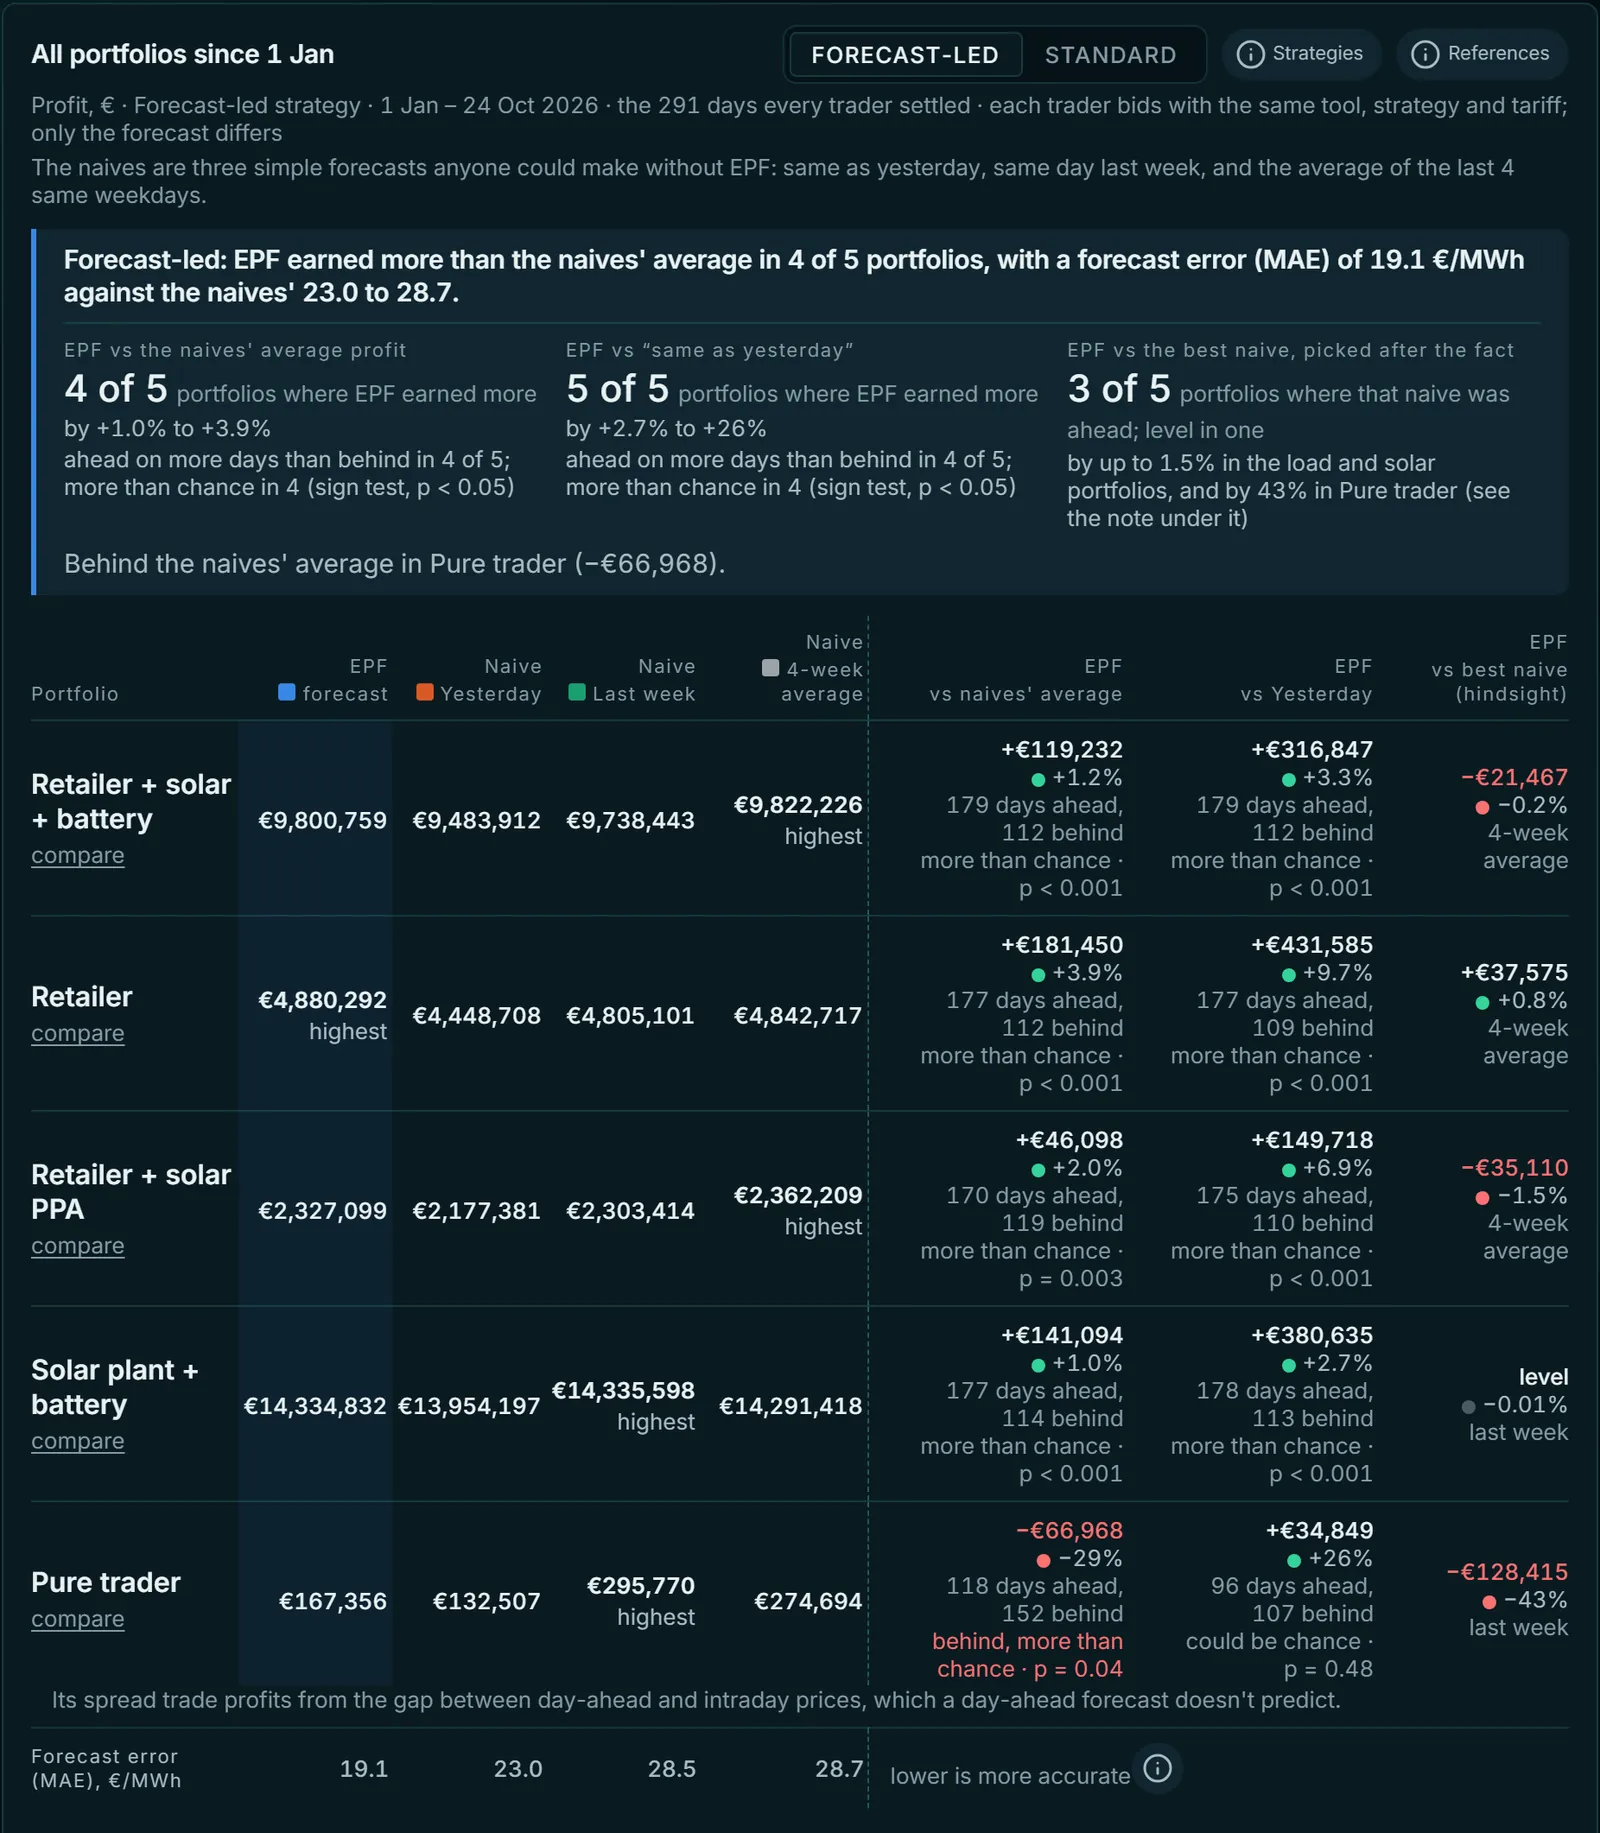
Balance: the same portfolios on EPF's forecast and on naive forecasts since 1 January.
- First visit: four numbered steps and one button, Start with a suggested portfolio.
- Balance: a one-line verdict above the table.
- Replay: rehearse a past day.
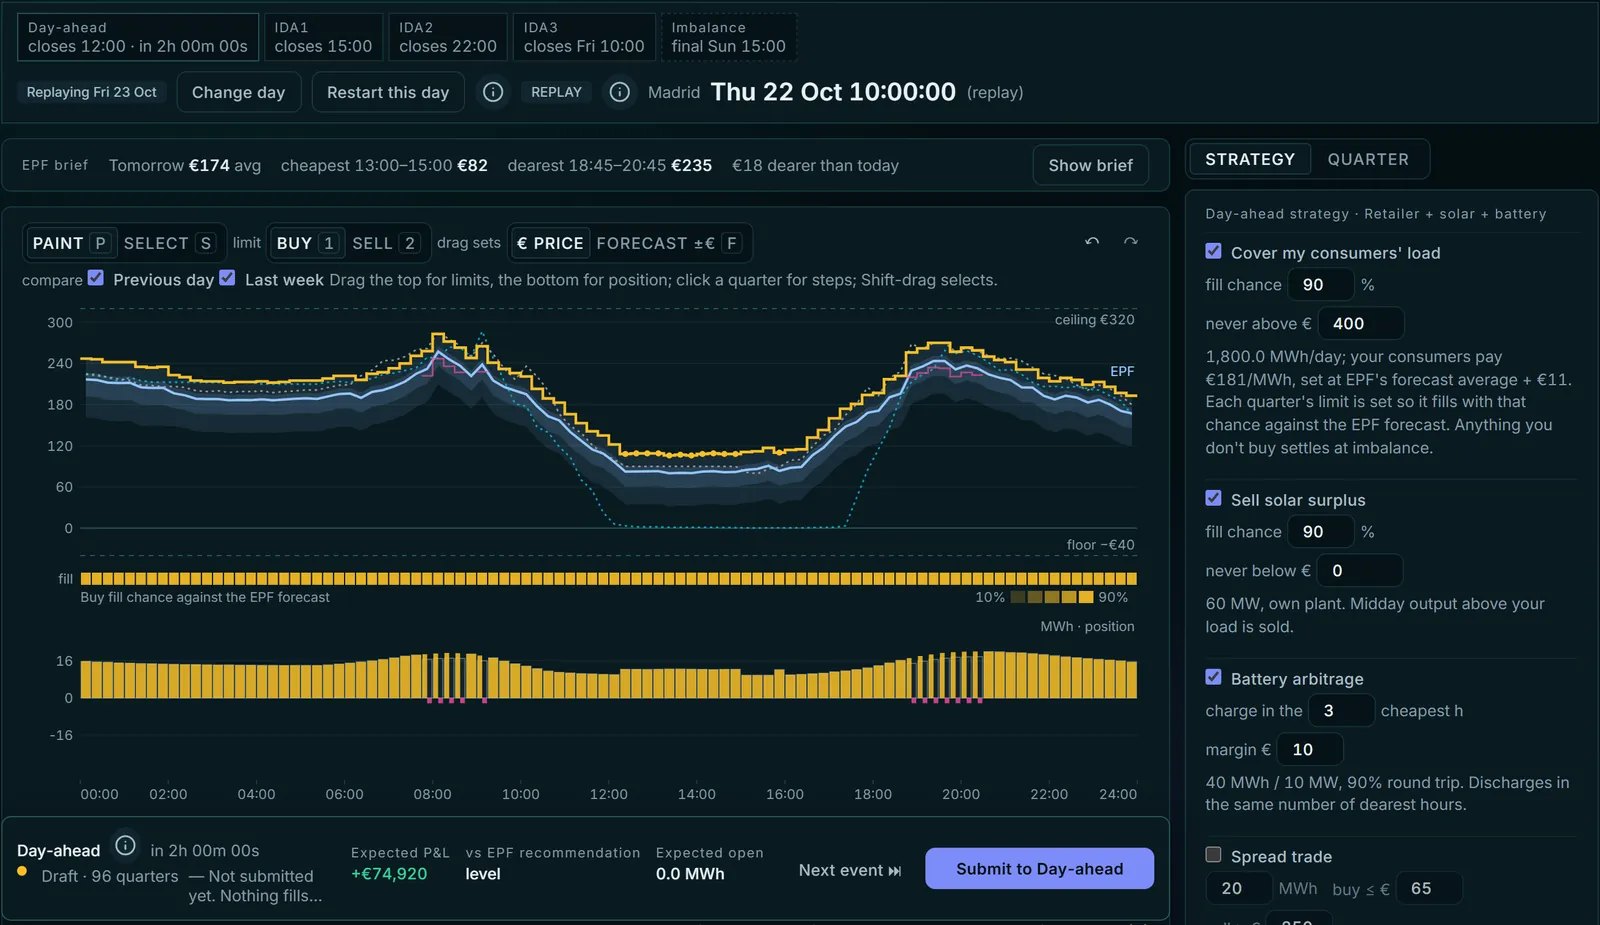
Replay: a past day on its real prices, with the clock starting the morning before.
Replay picks a past day from a calendar and a portfolio, then starts the clock the morning before. Next event jumps to the next deadline or result, and each step shows only what was known by then. Replay results stay in your browser, out of the live record.
Track record
Section titled “Track record”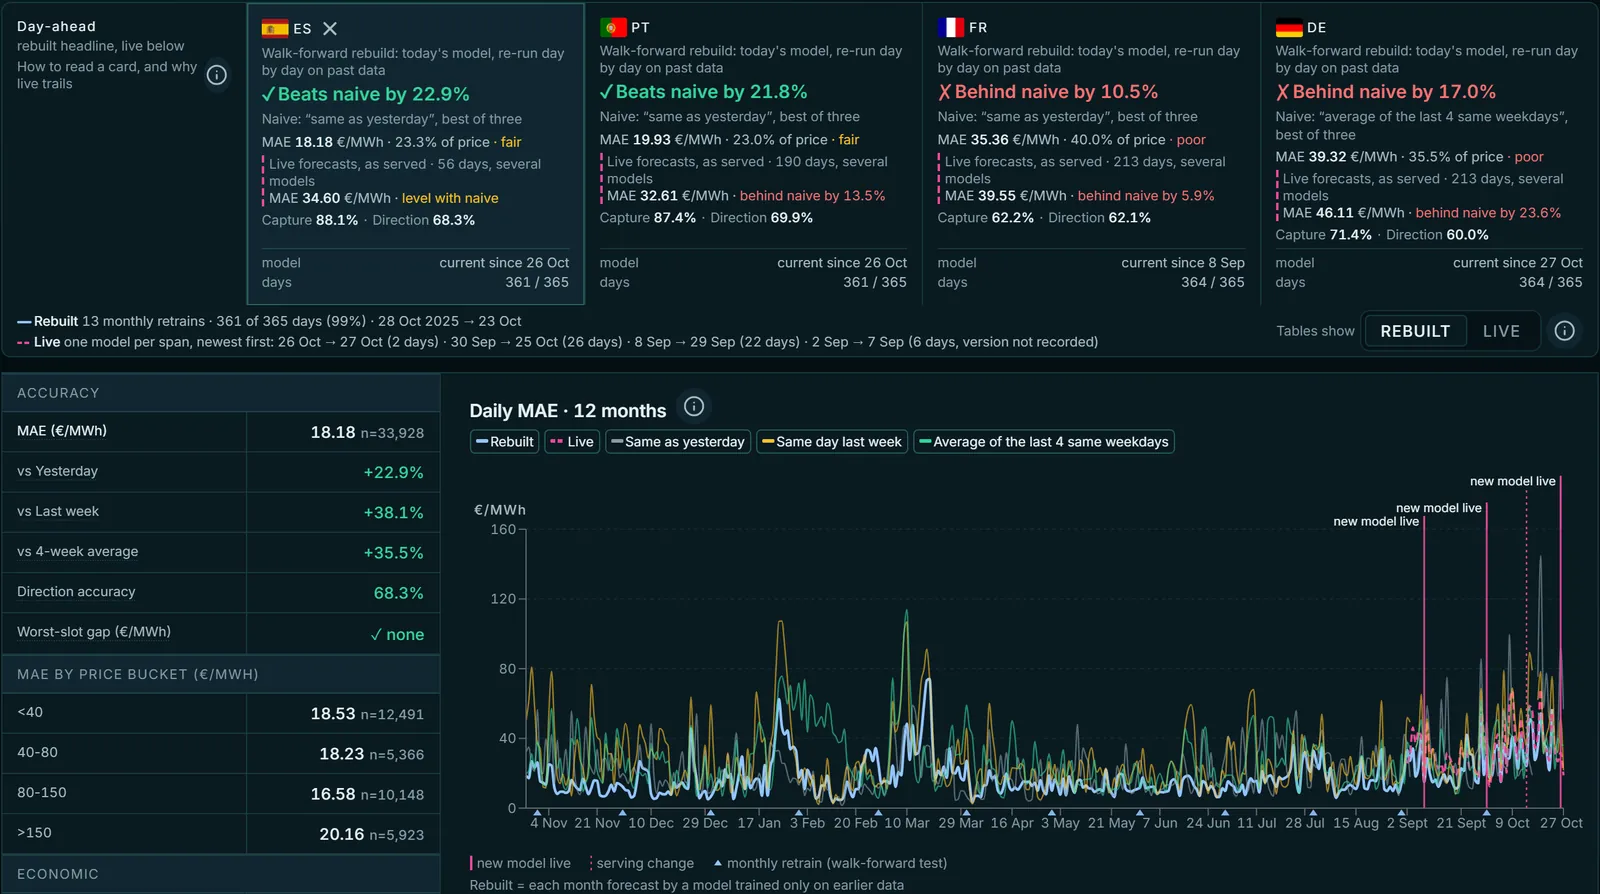
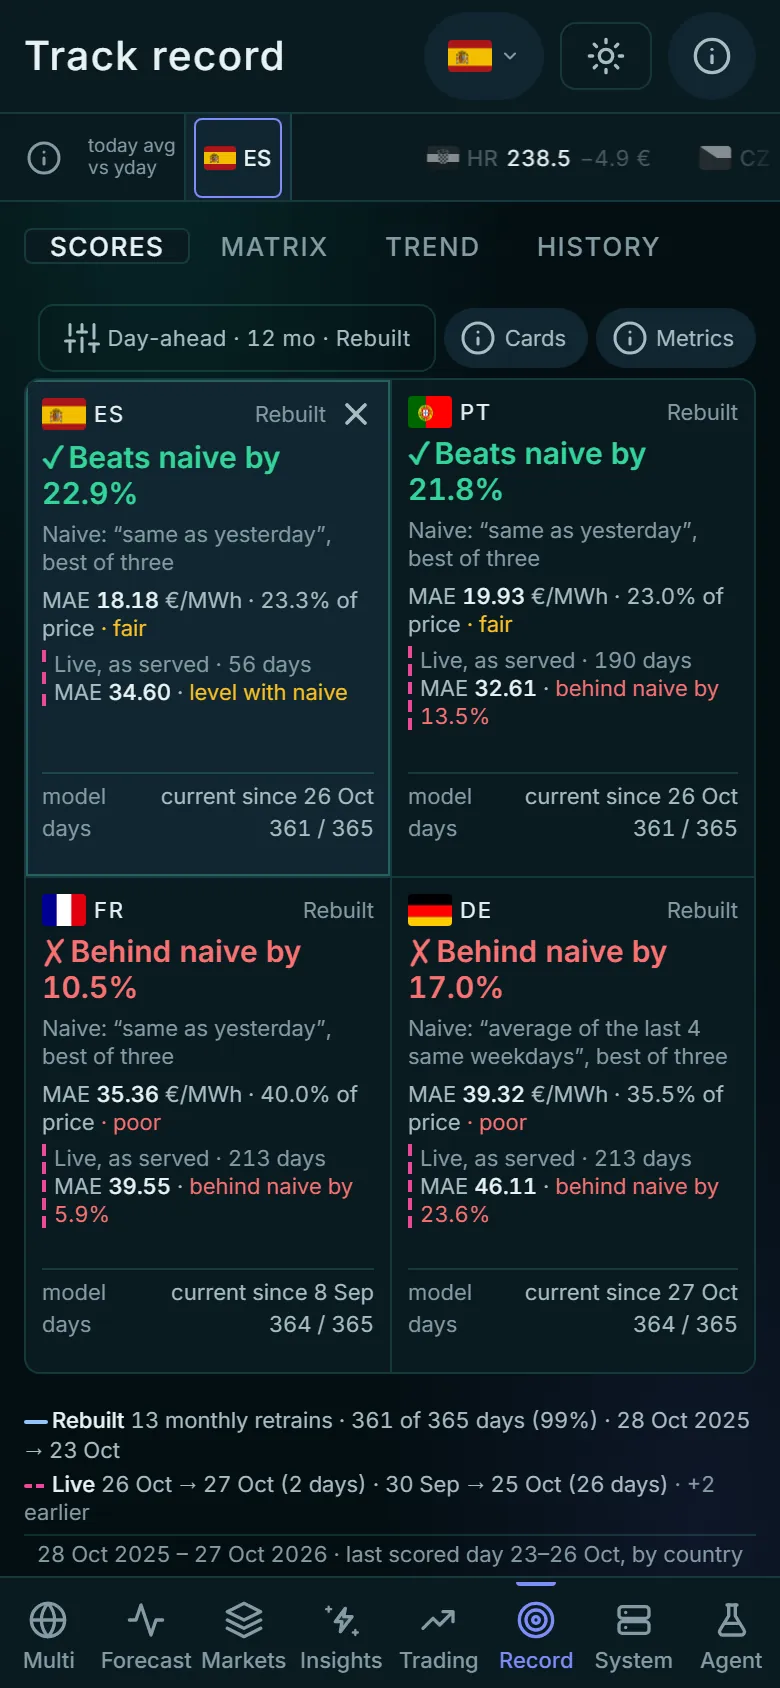
Accuracy against three naive baselines: a 12-month walk-forward record and the live record.
| Tab | Shows |
|---|---|
| Scores | The verdict per market |
| Matrix | EPF against each baseline |
| Trend | Error over time, with a marker on each day a new model went live |
| History | The models that served each month |
Figures and what they mean: Track record.
System and Research
Section titled “System and Research”- System: pipeline status, data freshness and model health for each market.
- Research (Agent on a phone), last in the menu: opens the automated research pipeline’s page in a new tab, with what it has measured and which results wait for a person. Password-protected.